Figure 1 - National Successes
Figure 2 - National Challenges
Future Wave of Seniors (Adults aged 50–64 in 2014 and 1999)
Compared to the current senior population when they were middle-aged, the next wave of seniors:

Figure 3
Future Wave of Seniors (Adults aged 50–64 in 2014 and 1999) Compared
The US senior population is projected to grow 49.5% by 2030.
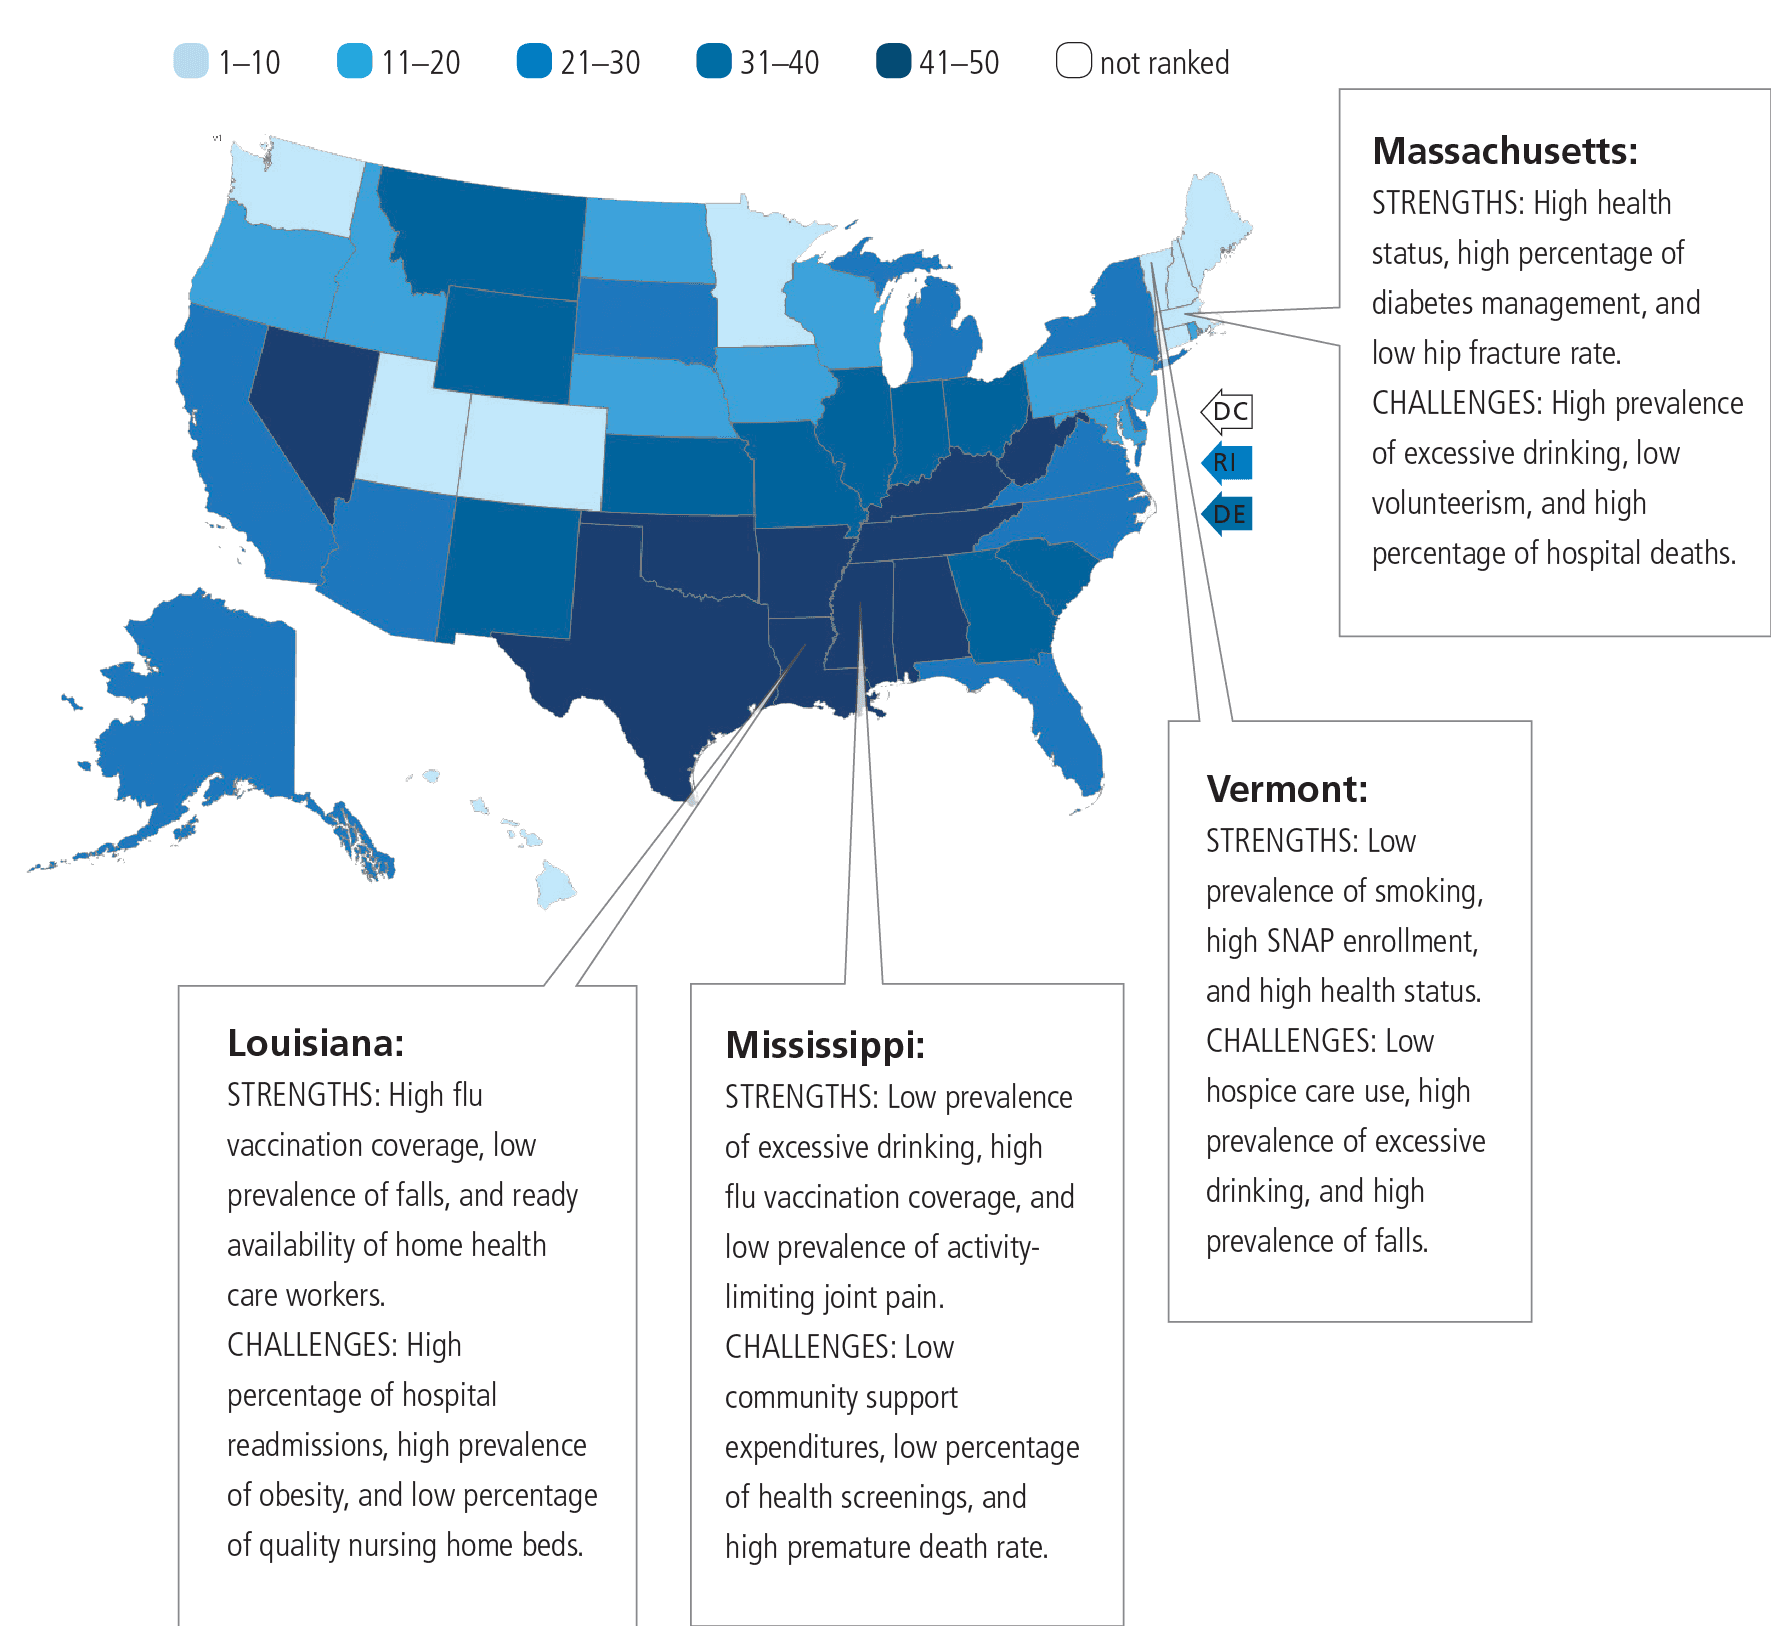
Several items are noteworthy when reviewing the changes in senior health over the past year. The nation as a whole has experienced successes and challenges. Successes include:
- A 9% decline in the rate of preventable hospitalizations from 59.3 to 53.8 discharges per 1,000 Medicare beneficiaries,
- An 8% reduction in the prevalence of full-mouth teeth extractions from 16.1% to 14.9% of adults aged 65 and older, and
- A 5% decrease in hip fractures from 6.2 to 5.9 hospitalizations per 1,000 Medicare beneficiaries. Challenges include:
- A 7% decrease in community support from $873 to $811 per adult aged 65 and older in poverty,
- A 7% decrease in home-delivered meals from 20.6% to 19.1% of seniors in poverty,
- A 10% decrease in the reach of the Supplemental Nutrition Assistance Program (SNAP) from 75.2% to 67.4% of seniors in poverty, and
- A 5% increase in food insecurity from 14.8% to 15.5% of adults aged 60 and older.
Now in its fourth edition, successes and challenges can be examined over a three year timeframe. Three-year successes include:
- An 18% increase in home health care workers from 93.8 to 110.6 workers per 1,000 adults aged 75 and older,
- A 40% increase in hospice care use from 36.7% to 51.4% of decedents aged 65 and older,
- A 29% decrease in hospital deaths from 30.1% to 21.5% of decedents aged 65 and older, and
- A 7% increase in health status from 38.4% to 41.2% of adults aged 65 and older reporting very good or excellent health.
Looking at changes over the last three years also accents a major challenge facing the senior population, a 9% increase in obesity from 25.3% to 27.5% of adults aged 65 and older. This compares to a 6% increase in obesity in the general population over the same time period.
Maintaining and improving the health of seniors is challenged by two factors the rapidly increasing number of individuals in this age group and the healthiness of the individuals moving into this age group. By 2030, the number of seniors is projected to increase by 49.5% from approximately 49,360,000 in 2016 to 73,789,000 in 2030.[1] The future cohort of seniors (adults aged 50–64 years in 2014) differs from the current cohort of seniors (adults aged 50–64 years in 1999) 15 years ago. Compared with the current cohort of seniors, the prevalence of smoking is half among the future cohort, but the prevalence of obesity is 25% higher, the prevalence of diabetes is 55% higher, and the percentage reporting very good or excellent health is 9% less (Figure 3). Over the next 15 years, the health of this population will be challenged by large numbers of new people becoming seniors and the additional health challenges, such as diabetes, that this groups brings with them.
[1] The 2015 MSA Profile. Woods & Poole Economics, Inc. Washington, DC.
Senior Health Steering Group
From its beginning, America’s Health Rankings® Senior Report has had as its foundation and touchstone the Senior Health Steering Group (SHSG), a panel of experts in senior health. With the launch of the first report, the panel was charged with
- identifying the areas of health and well-being most pertinent to older adults, and
- creating a model for assessing population health at a state level.
Before each edition, the panel re-convenes to review the model and the measures.
2016_Ranking-Fig4-2015_Seniors-Findings
 Alabama
 Alaska
 Arkansas
 Arizona
 California
 Colorado
 Connecticut
 Delaware
 Florida
 Georgia
 Hawaii
 Idaho
Idaho Illinois
 Indiana
 Iowa
Iowa Kansas
 Kentucky
 Louisiana
 Maine
Maine Maryland
 Massachusetts
 Michigan
 Minnesota
 Mississippi
 Missouri
 Montana
 Nebraska
 Nevada
 New Hampshire
 New Jersey
 New Mexico
 New York
 North Carolina
 North Dakota
 Ohio
Ohio Oklahoma
 Oregon
 Pennsylvania
 Rhode Island
 South Carolina
 South Dakota
 Tennessee
 Texas
Texas Utah
Utah Vermont
 Virginia
 Washington
 West Virginia
 Wisconsin
 Wyoming
 District of ColumbiaAppendixDescription of Core MeasuresDescription of Supplemental MeasuresMethodology2016 Model Development2016 Senior Health Advisory GroupThe TeamExecutive SummaryConclusionAmerica’s Health Rankings® Expansion
