We appreciate you taking the time to help America’s Health Rankings better understand our audiences. Your feedback will allow us to optimize our website and provide you with additional resources in the future. Thank you.
Please select one option which best describes your profession or field of expertise
Journalist or media professional
Health Policy Professional
Public health professional (state, local, or community level)
The social, economic and environmental conditions surrounding children shape their health, development and opportunities across the lifespan. America’s Health Rankings® reports a range of measures related to socioeconomic conditions at the national and state levels. Even within states, these conditions can vary widely, making more granular data essential for understanding local differences.
To support more targeted action, America’s Health Rankings publishes selected measures at the county level and recently introduced a new interactive map featuring concentrated disadvantage data.
Concentrated Disadvantage: Measuring Socioeconomic Factors Shaping Community Health
that examines multiple aspects of geographically concentrated poverty, differences in income across communities and other population characteristics. Collected by the U.S. Census Bureau, it considers poverty, unemployment, use of public assistance programs and density of female-headed households and households with children.
Across the United States, 25.8% of households with children are living in areas experiencing concentrated disadvantage, according to 2020-2024 data. Studies have found that living in areas of higher community socioeconomic disadvantage is associated with outcomes such as preterm birth,
New Interactive Map of County-Level Data Shows Variations that Statewide Values May Mask
A county-level map of the U.S. brings local patterns into focus. Counties with higher and lower values often sit alongside one another, reflecting differences in local economies, population characteristics and access to resources.
Select a state to explore county-level data. *
Concentrated Disadvantage by County
Percentage of households with children that are located in census tracts for which the averaged z-score of the following factors is above the 75th percentile: family households below the poverty line, female-headed households, individuals receiving public assistance, unemployed population age 16 and older and population younger than 18. Counties in higher quintiles have greater disadvantage relative to all U.S. counties.
Select a state
e.g. New York
Loading map…
Data from 2020-2024
0.0%
0.1% - 4.1%
4.2% - 21.0%
21.1% - 40.6%
40.7% - 100.0%
Counties are grouped into five categories, or quintiles, based on a comparison against all counties nationwide. Notably, the additional detail afforded by county-level data shows how much variation there is in the level of concentrated disadvantage within states. In some states, there are counties where 0.0% of the population lives in a census tract experiencing concentrated disadvantage, and other counties with a value of 100.0%, a much broader range than at the overall state level (2.6%-47.9%). Therefore, the values defining five quintiles shown on the county-level map are different from those in the state-level map and provide a more detailed understanding of the variation in socioeconomic circumstances experienced by communities across the country.
State Data Provide a Comparable Benchmark
While county-level data reveal local differences, state-level data provide a standardized view of concentrated disadvantage across the country. Each state’s value represents the percentage of households with children living in census tracts that average above the 75thpercentile in the five subcomponent measures. States are also grouped into five quintiles based on their values relative to all states nationwide.
Statewide values offer a useful benchmark, but do not show how concentrated disadvantage is distributed within a state. As illustrated in the county-level map, these socioeconomic conditions may be widespread across many counties or confined to a smaller number of communities. Viewed together, county-level data help reveal those differences. **
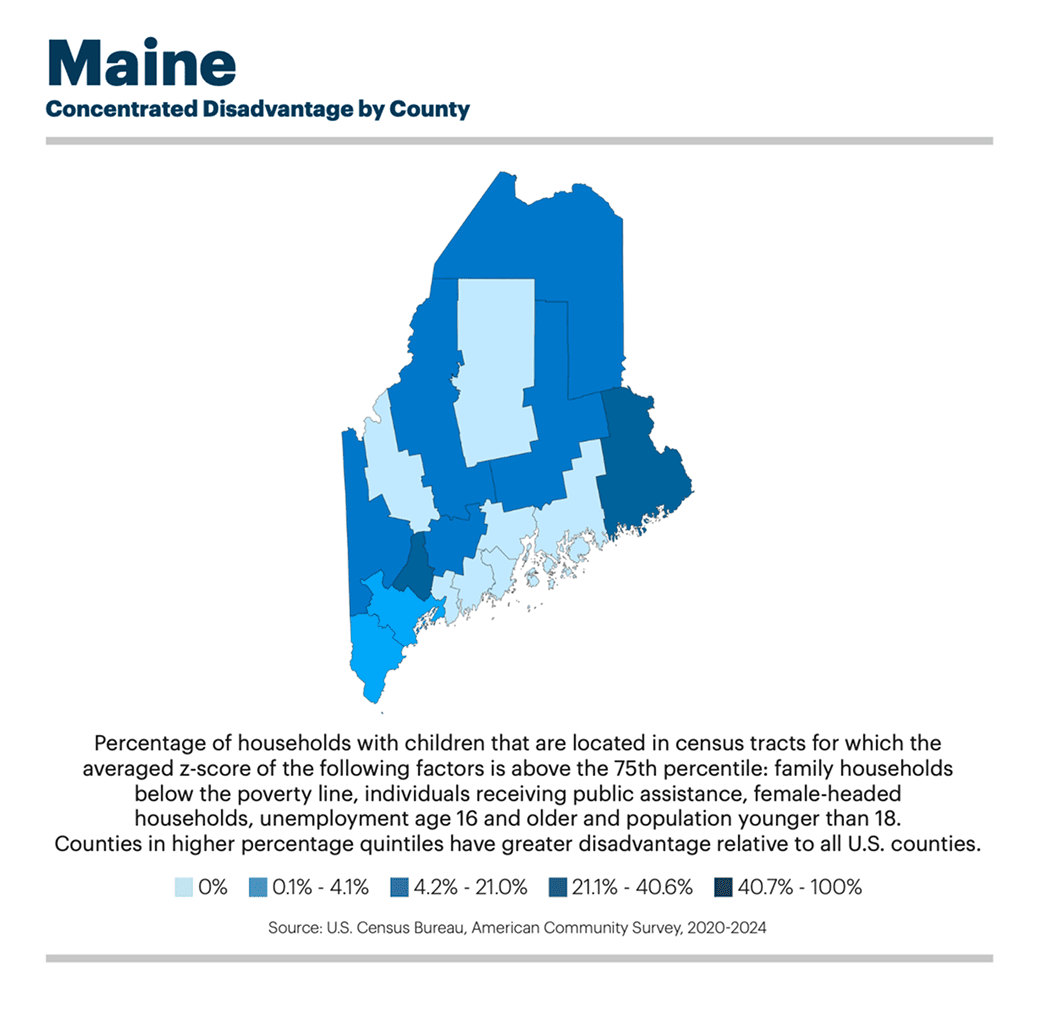
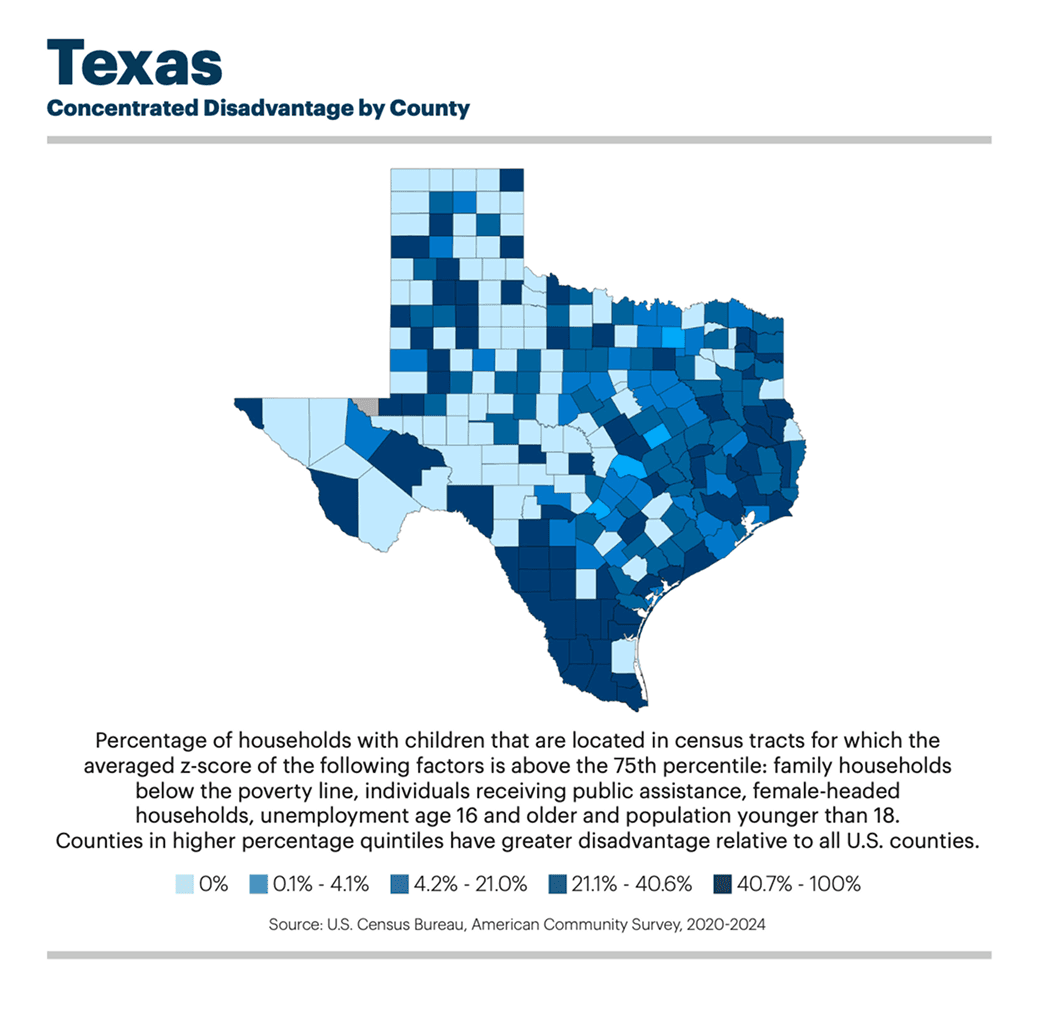
To see how county-level data add context to statewide results, take a closer look at Maine (No. 3) and Texas (No. 47), which rank among the highest- and lowest-performing states in concentrated disadvantage, respectively.
Maine: Low Statewide Value Masks Significant County Variation
Maine ranked the third-healthiest state for concentrated disadvantage in 2020-2024, though county-level data reveal meaningful variation. Of Maine’s 16 counties, seven ranked among the first (healthiest) quintile for concentrated disadvantage.
However, despite the state’s high overall ranking, two of its counties ranked in the fourth (second-least-healthy) quintile. For example, in Washington County and Androscoggin County, 1 in 4 households with children (26.2% and 25.0%, respectively) lived in census tracts experiencing concentrated disadvantage.
Texas: Broad Range of County Values Despite Less-Healthy State Ranking
Texas ranked No. 47 nationally, placing it among the 10 least healthy states for concentrated disadvantage. In 2020-2024, 34.9% of households with children in the state lived in areas experiencing concentrated disadvantage.
Similarly to Maine, the statewide value masks substantial county variation. Eighty-five of Texas’s 253 counties ranked among the healthiest quintile for concentrated disadvantage of all counties nationwide, while 71 fell within the least healthy. This wide range shows how sharply community conditions can differ across a large, populous state with major urban settings and extensive rural areas.
Using Local Data to Understand Community Needs
By helping leaders identify where socioeconomic barriers overlap most acutely, county-level data can inform location-based strategies that strengthen the conditions supporting children’s development, families’ well-being and better community health.
To explore concentrated disadvantage data in your state, see the America’s Health Rankings®Concentrated Disadvantage measure.
* Note: Not all states use a traditional county system. The map data reflects U.S. Census-designated boundaries; which include boroughs in Alaska; parishes in Louisiana; independent cities in Maryland, Missouri, Nevada and Virginia; and Councils of Governments (COGs)/Planning Regions in Connecticut in place of historical counties.
** Concentrated disadvantage is one lens for understanding community conditions and does not provide a complete assessment of a state’s health or explain its overall America’s Health Rankings standing. Any state comparisons in this article apply only to the concentrated disadvantage measure.