Data on older adult health show encouraging strides in reducing early death rate and improving social connectedness; however, both mental and behavioral health challenges persist
The older adult population across the United States is steadily increasing and is projected to grow significantly in the coming years — currently comprising more than 59 million individuals. As this population of community members, parents, grandparents, mentors and friends continues to grow, it is essential to the well-being of the nation that we understand their health.
The America’s Health Rankings® 2025 Senior Report examines 55 measures of health, drawn from 24 distinct data sources, to present a comprehensive overview of the health and well-being of the nation's older adults. This year’s report offers an encouraging snapshot of older adult health, including a decrease in the early death rate, improvements in social support and engagement, and an increase in the number of geriatric clinicians. Despite these positive developments, drug-related deaths and suicides among older adults continued to worsen, reaching the highest levels ever recorded by America’s Health Rankings. In addition, the poverty rate worsened for older adults.
The report highlights data that communities can use to build on successes, sustain momentum and develop new solutions to address ongoing and emerging challenges in older adult health. We encourage leaders to explore state-level data to uncover trends, identify strengths and pinpoint areas for improvement — using these insights to guide targeted, data-driven action.
The early death rate among adults ages 65-74 decreased, building on recent progress and approaching 2019 levels
The early death rate — number of deaths per 100,000 adults ages 65-74 — decreased 9% from 1,979 to 1,810 deaths between 2022 and 2023. This drop represents 40,900 fewer deaths compared with the previous year, and it approaches the 2019 rate of 1,765 deaths per 100,000 adults ages 65-74. The improvement follows a sharp rise in early deaths between 2019 and 2021 when the rate climbed to 2,151 deaths per 100,000 adults ages 65-74.
Chronic diseases accounted for six of the top 10 causes of early death among adults ages 65-74 in 2023. The chronic conditions contributing the most to early death included cancer, heart diseases, chronic lower respiratory diseases (such as chronic obstructive pulmonary disease and asthma), cerebrovascular diseases (stroke), diabetes and liver disease. Unintentional injury ranked as the sixth-leading cause of early death, with more than half of these cases attributed to unintentional poisonings (including drug deaths) and falls.
Falls and obesity remained level among older adults in recent years
Some key health outcomes that contribute to morbidity and mortality, such as
falls and
obesity, remained relatively stable in the past several years after peaking earlier this decade.
Falls — the percentage of adults age 65 and older who reported falling in the past 12 months — showed no significant change between 2020 and 2023. The percentage of older adults reporting falls has not changed since it significantly decreased between 2016 and 2018. However, in 2023, there were differences in the prevalence of falls across almost all demographic groups. For example, falls were more common in rural areas than in cities. In 2023, 31.8% of older adults living in nonmetropolitan (rural) areas reported falling compared with 27.0% living in metropolitan (urban and suburban) areas. In addition, in 2023, 58.3% of older adults with difficulty with self-care reported falling compared with 18.9% of adults without a disability.

From 2021 to 2023, the national prevalence of obesity among older adults also remained stable, impacting roughly three in 10 older adults. This follows a period of steady increase between 2011 and 2019. Geographic differences were also evident: Obesity prevalence was significantly higher among adults age 65 and older living in nonmetropolitan compared with metropolitan areas during the same period (33.7% vs. 29.4%).
Contributing factors for obesity are complex and include certain health conditions; genetic predisposition; environmental elements like neighborhood safety, food access and infrastructure; and behaviors such as poor diet and physical inactivity. In 2023, 29.0% of older adults met federal physical activity guidelines, which recommend 150 minutes of moderate or 75 minutes of vigorous aerobic activity and two days of muscle strengthening per week.
Suicide and drug deaths rose among older adults, with differences by gender and race/ethnicity
Despite recent decreases in the early death rate for adults ages 65-74, both suicide and drug deaths have increased — reaching the highest rates recorded since
America’s Health Rankings began tracking them (2009-2011 for suicide and 2008-2010 for drug deaths).
Suicide rates rose by 5%, increasing from 16.9 to 17.7 deaths per 100,000 adults age 65 and older between 2018-2020 and 2021-2023. The data revealed substantial gender differences, with suicide rates among men six times higher than among women (32.6 vs. 5.4 deaths, respectively, per 100,000 adults age 65 and older). Differences between racial/ethnic populations were also notable: Suicide rates were 4.5 times higher among white (21.4) than Black (4.8) older adults during the same period.
Both suicide and drug deaths have increased — reaching the highest rates recorded since America’s Health Rankings began tracking them.
Drug deaths — the number of deaths due to drug injury, including unintentional, suicide, homicide or undetermined — increased 58%, rising from 8.4 to 13.3 deaths per 100,000 adults age 65 and older between 2018-2020 and 2021-2023.
The data also revealed stark differences by race and ethnicity: Drug deaths were 14.1 times higher among Black than among Asian older adults (36.7 vs. 2.6 deaths per 100,000 adults age 65 and older). Additionally, gender differences were pronounced among older adults, with drug death rates 2.6 times higher among men (20.0) than among women (7.8).
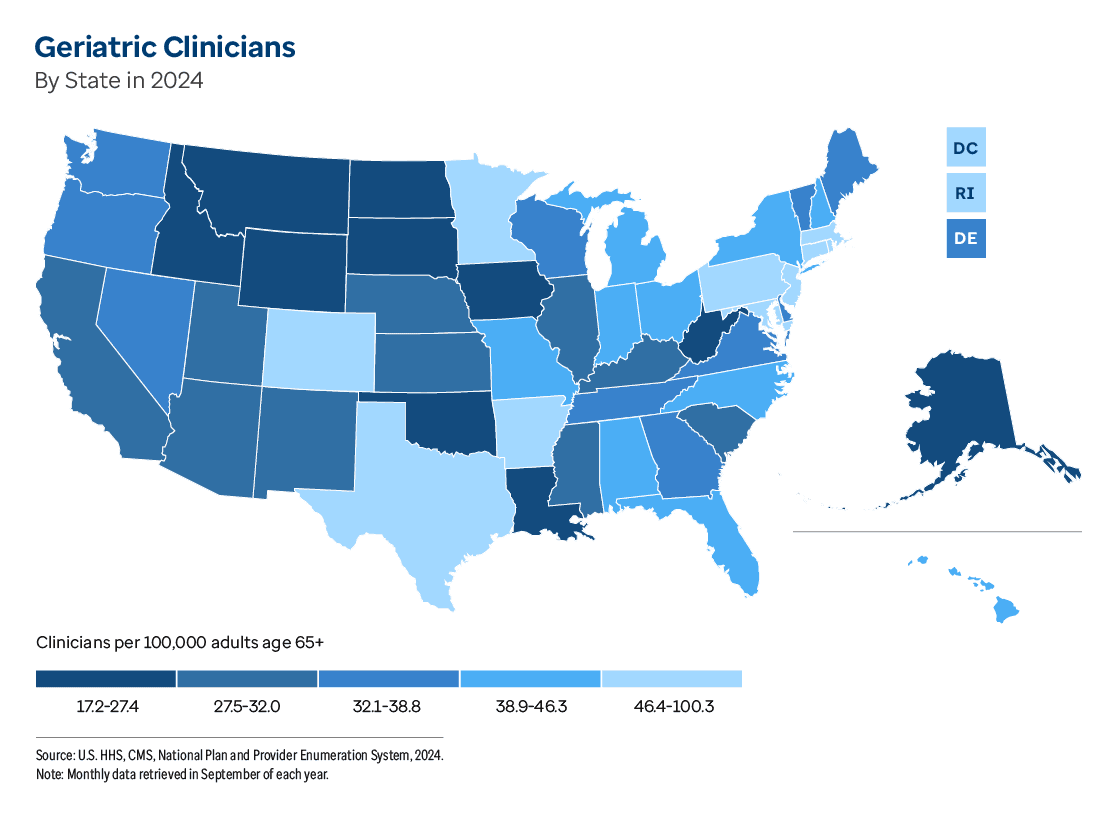
The number of geriatric clinicians has increased, but some states have notably fewer, and gaps in preventive clinical care remain
Geriatric clinicians are trained to meet the needs of older adults and are
better suited to treat and manage aging-related conditions. Between September 2023 and September 2024, the number of geriatric clinicians — family medicine and internal medicine geriatricians and nurse practitioners per 100,000 adults age 65 and older — increased 5%, from 38.0 to 39.9 clinicians per 100,000 adults age 65 and older. This is the highest rate recorded by
America’s Health Rankings. Despite the national increase in geriatric clinicians, there were differences by state. In 2024, the rate of geriatric clinicians was 4.3 times higher in the state with the highest rate of geriatric clinicians (Rhode Island), at 73.7 clinicians per 100,000 older adults, compared to the state with the lowest rate (South Dakota), at 17.2.
However, experts and researchers have repeatedly documented a shortage of providers trained to care for older adults. For example, the American Geriatrics Society projects that by 2030, the growing older adult population in the U.S. will require over 12,000
geriatricians.
Other clinical care indicators underscore opportunities for improvement and prevention. Between 2022 and 2023, flu vaccination coverage declined by 6%, from 67.7% to 63.4% of adults age 65 and older. In 2024, only around one in three (33.0%) of adults age 60 and older received a respiratory syncytial virus (RSV) vaccination. While the vaccine is relatively new, coverage remains low given the 2023 recommendation that all adults age 75 and older, as well as those ages 60-74 with risk factors, receive it. Older adults are more likely to develop severe illness and require hospitalization due to RSV; every year in the United States, an estimated 100,000 to 150,000 older adults are
hospitalized for the virus.
Measures of social support and engagement recently improved for many older adults while poverty worsened, with persistent differences between racial and ethnic groups
Community engagement and social support have been shown to improve the quality of life for older adults, contributing to better health outcomes such as reduced risk of disability,
depression and
dementia. Between 2021 and 2023, volunteerism among adults age 65 and older rose by 19%, increasing from 22.1% to 26.3%. However, the volunteerism rate remains below the 2019 level of 28.5%.
Volunteerism did not increase equally across groups, and the most recent data show differences by education level. In 2023, volunteerism among older adults was 4.4 times higher among college graduates (37.8%) compared with those with less than a high school education (8.5%).
Access to high-speed internet among households with adults age 65 and older — a vital resource for work, education and effective communication — also improved. Older adults in 28 states experienced increased access to high-speed internet, representing a national increase of 2% from 84.8% to 86.5% between 2022 and 2023. However, in the same period, there has also been a rise in the number of adults age 60 and older who reported being the victim of internet crime, which grew by 5% or more in 25 states.
While improvements in social support and engagement are encouraging, poverty has worsened among older adults. The percentage of older adults age 65 and older living below the poverty level increased 4% from 10.9% to 11.3% between 2022 and 2023. Poverty is a key social determinant of health, linked to increased exposure to
environmental risks,
health-related behaviors and a higher likelihood of chronic disease and premature death.
Racial differences in poverty remain: In 2023, the percentage of older adults living below the poverty level was 2.1 times higher among those who identified as other race (19.5%) and Black (19.2%) older adults compared with white older adults (9.1%).
Several bright spots in older adult health highlight opportunities for leaders to build on successes and address persistent challenges
The data in this report underscore meaningful progress in recent years, including decreases in the early death rate and strengthened social connectedness among older adults. We encourage communities and leaders nationwide to leverage these insights — along with the detailed state-level and demographic group data available across the America’s Health Rankings platform — to amplify progress, confront ongoing challenges and promote the health and well-being of all older adults.
 US Summary
 Alabama
 Alaska
 Arizona
 Arkansas
 California
 Colorado
 Connecticut
 Delaware
 District of Columbia
 Florida
 Georgia
 Hawaii
 Idaho
Idaho Illinois
 Indiana
 Iowa
Iowa Kansas
 Kentucky
 Louisiana
 Maine
Maine Maryland
 Massachusetts
 Michigan
 Minnesota
 Mississippi
 Missouri
 Montana
 Nebraska
 Nevada
 New Hampshire
 New Jersey
 New Mexico
 New York
 North Carolina
 North Dakota
 Ohio
Ohio Oklahoma
 Oregon
 Pennsylvania
 Rhode Island
 South Carolina
 South Dakota
 Tennessee
 Texas
Texas Utah
Utah Vermont
 Virginia
 Washington
 West Virginia
 Wisconsin
 Wyoming


