The 36th Annual Report highlights recent progress and emerging challenges in the nation’s health
As the health of our nation continues to shift, reliable data can serve as the basis for targeted action. The United Health Foundation’s America’s Health Rankings® 2025 Annual Report analyzes 99 measures of health and well-being drawn from 31 distinct data sources to provide a comprehensive portrait of health at both the national and state levels, spanning five model categories of health outcomes and the factors that shape them.
This year’s findings reveal encouraging signs of progress. National mortality rates improved, with reductions in premature death and drug death rates. Cancer screenings, physical inactivity and volunteerism also improved. Yet these gains were tempered by continued increases in multiple chronic conditions among adults, as well as growing socioeconomic challenges like homelessness, which underscore persistent challenges related to community well-being.
The report further examines differences across populations by age, income, educational attainment and other demographics, and takes a closer look at how the health of those living in rural (nonmetropolitan) areas compares with that of their metropolitan counterparts.
“What makes America’s Health Rankings especially valuable is its ability to turn complex data into clear, actionable insights to help leaders move between evidence and impact.”
– Jonathan Fielding, MD, Distinguished Professor of Health Policy and Management, UCLA Fielding School of Public Health; Distinguished Professor of Pediatrics, David Geffen School of Medicine at UCLA
“As we reflect on the findings in this year’s Annual Report, we must rededicate ourselves to improving health care in this country and creating a healthier nation for all.”
– Margaret-Mary Wilson, MD, Executive Vice President & Chief Medical Officer, UnitedHealth Group
Users can explore population data by metropolitan status for a variety of measures by looking for this icon throughout the Executive Brief, comprehensive
2025 Annual Report and State Summaries.
Please view the full
2025 Annual Report and additional resources for more information on
sources and
methodology.
Premature deaths fell; drug deaths improved for the first time since 2018
Premature death decreased 8% between 2022 and 2023, from 8,522 to 7,862 years lost before age 75 per 100,000 population, after rising sharply amid the COVID-19 pandemic in 2020 and 2021. This included significant improvements across 44 states, led by reductions of 13% in Maine (9,327 to 8,082) and 12% in both South Dakota (9,120 to 8,047) and West Virginia (13,647 to 12,053). In 2023, the top five
leading causes of premature death — unintentional injury, cancer, heart disease, suicide and homicide — were largely consistent with the year prior. Homicide replaced COVID-19 in the top five, after previously being the sixth-leading cause of premature death.

During the same time period, the drug death rate decreased 3%, from 32.4 to 31.4 deaths per 100,000 population. The recent improvement represents roughly 2,900 fewer deaths nationwide and marks a meaningful reversal after years of steady increases; this is the first national improvement since 2018. However, the drug death rate, which Healthy People 2030 considers a leading health indicator for the U.S., remains far above the goal to reduce the rate to
20.7 deaths per 100,000 population. Nationwide, drug deaths have risen steeply over the past two decades,
increasing more than 500% between 1999 and 2022 to become a leading cause of injury-related death.
Fourteen states experienced significant improvements between 2022 and 2023, led by North Carolina, where the drug death rate fell 19% from 40.3 to 32.5 deaths per 100,000 population. Nine states have met the Healthy People 2030 target, with Nebraska having the lowest drug death rate of 8.7 deaths per 100,000.
The number of mental health providers continued to grow; several behavioral health measures showed signs of stabilizing
The number of mental health providers increased 5%, from 344.9 to 362.6 providers per 100,000 population, between September 2024 and September 2025. Mental health providers increased 5% or more in 34 states in this time period, led by Nebraska (346.9 to 380.7) and North Dakota (258.3 to 284.2), both with 10% increases. Nationally, this continues a longer-term improvement of 57% since September 2018 (230.5).
After years of worsening trends, several measures of mental health held steady in the most recent period:
- Frequent mental distress — the percentage of adults who reported their mental health was not good 14 or more days in the past 30 days — remained stable (15.4% to 15.6%) between 2023 and 2024. This comes after a 33% increase since 2011.
- Depression also remained steady between 2023 and 2024, at 22.0% of adults. Differences by gender persisted, as rates of depression were 1.7 times higher among women (26.5%) compared with men (15.4%).
- The suicide rate remained relatively unchanged between 2022 and 2023 (14.8 to 14.7 deaths due to intentional self-harm per 100,000 population), after increasing 23% since 2009 (12.0). This rate remains higher than the Healthy People 2030 target to reduce the rate to 12.8 deaths per 100,000 population.
- Non-medical drug use — including misuse of pain relievers, stimulants, and sedatives or illicit drugs — did not change significantly between 2024 and 2025 (17.6% to 16.8%), after rising 49% since 2019 (11.3%). Still, almost 44.2 million adults nationwide reported drug use in 2025.
Several measures of clinical care and health behaviors improved nationwide
Cancer screenings increased 15% between 2022 and 2024,
from 56.0% to 64.5% of adults who received recommended colorectal and/or breast cancer screenings. There were significant improvements in 47 states and Washington, D.C. Racial/ethnic differences persisted: Cancer screening prevalence was 1.3 times higher among white (67.7%) and Black (67.4%) adults compared with Hispanic (52.8%) adults.
Preventive screenings can help improve outcomes by detecting cancers early, when there are more treatment options.
During this time, colorectal cancer screening increased 15%, from 61.8% to 71.1% of adults ages 45-75, and breast cancer screening increased 3% nationwide, from 72.1% to 74.5% of women ages 40-74. However, both remained below the Healthy People 2030 goals of
72.8% of adults ages 45-75 years and
80.3% of females ages 50 to 74 years, respectively.
Both colorectal and breast cancer screenings remained below the Healthy People 2030 goals.
Physical inactivity reached its healthiest level since 1996, the earliest year for which
America’s Health Rankings has data on this measure. Between 2023 and 2024, the percentage of adults reporting no physical activity outside of work decreased 10%, from 24.2% to 21.8%, meeting the Healthy People 2030 goal of
21.8% of adults. Nineteen states recorded improvements, led by Minnesota with a 23% decrease in physical inactivity, from 22.8% to 17.5%.
Regular physical activity benefits people of all ages and can help prevent chronic conditions and mortality.
The percentage of adults living with three or more chronic conditions continued to rise, particularly among adults under age 45
Between 2023 and 2024, the percentage of adults who had three or more chronic health conditions — including arthritis, asthma, cancer, cardiovascular diseases, chronic kidney disease, chronic obstructive pulmonary disease (COPD), depression or diabetes — increased 6%,
from 10.7% to 11.3% of adults. The more chronic conditions an individual has, the
higher their risk for physical, social and cognitive limitations, as well as mortality.
While there were increases across multiple age groups, the largest was among adults ages 18-44; prevalence rose 17% in this group, from 3.0% to 3.5%. Additionally, the prevalence of multiple chronic conditions worsened in six states, led by Texas, which increased 24% from 8.3% in 2023 to 10.3% in 2024.
Obesity, a risk factor for other serious health conditions, stabilized at 34.2%, showing no meaningful change between 2023 and 2024. This plateau comes after a 23% increase between 2011 and 2023, from 27.8% to 34.3% of adults.
Spotlight
Rural Communities
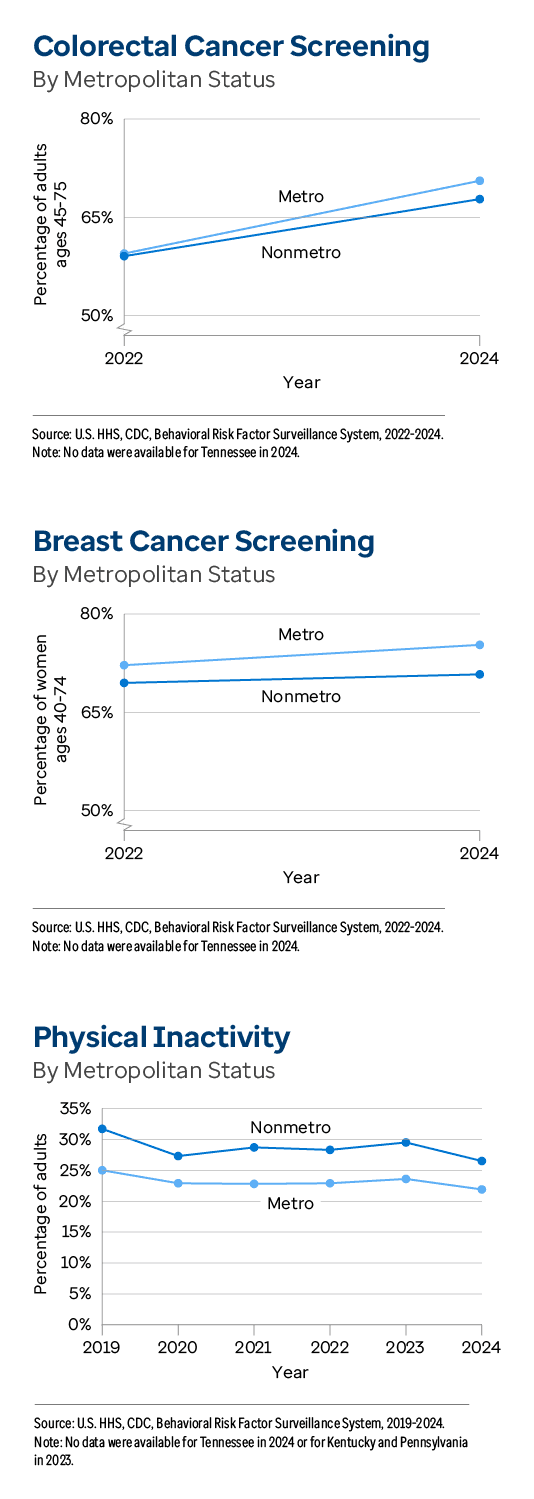
Notable improvements were made among adults living in rural areas, but differences in cancer screenings and physical inactivity persist compared with metropolitan peers Adults living in rural areas experienced meaningful improvements across some measures of clinical care and health behaviors, yet they continued to face distinct and persistent challenges that shape their health outcomes.
Cancer screening prevalence (which includes both colorectal and breast cancer screenings) improved 14% among adults in rural areas, from 53.6% to 61.3%, between 2022 and 2024. However, cancer screenings in metropolitan areas improved more during this time period, increasing 18% from 54.6% to 64.5%. Colorectal cancer screenings which increased 15% in rural areas (59.1% to 67.8%) among adults ages 45-75, but 19% in metropolitan areas (59.5% to 70.6%). Additionally, breast cancer screening rates were 1.1 times higher among metropolitan (75.3%) compared with rural (70.8%) women ages 40-74 in 2024, a gap in prevalence that has persisted over time.
On the other hand, the percentage of adults who reported doing no physical activity or exercise other than their regular job decreased more in rural communities than among their metropolitan peers. The prevalence of physical inactivity among adults living in rural areas improved 10% (29.5% to 26.5%) between 2023 and 2024, compared with 7% among their metropolitan counterparts (23.6% to 21.9%). Additionally, physical inactivity remained 1.2 times higher among rural compared with metropolitan adults.
Reductions in smoking may be offset by increases in e-cigarette use
Between 2023 and 2024, cigarette smoking decreased 4%
from 12.1% to 11.6% of adults. Smoking decreased 10% among adults ages 18-44 (11.1% to 10.0%) — the only age group that saw significant improvement. These reductions are encouraging, as
cigarette smoking remains the leading cause of preventable disease and death in the United States, responsible for more than 480,000 deaths each year. However, the overall prevalence remains above the Healthy People 2030 goal of reducing cigarette smoking to
6.1% of adults.
Smoking prevalence decreased in two states: 16% in Minnesota (12.2% to 10.2%) and 12% in Washington (9.0% to 7.9%).
However, during the same period, e-cigarette use — including use of other electronic vaping products — increased 4%, from 7.7% to 8.0% of adults. E-cigarette use increased significantly in two states: 41% in Wyoming, from 7.6% to 10.7% of adults, and 26% in Wisconsin, from 6.6% to 8.3%.
Increasing e-cigarette use, particularly among young adults, raises concern about long-term health impacts and nicotine dependence.
Both cigarette smoking and e-cigarette use were more prevalent among adults in rural communities. Smoking was 1.5 times higher among rural (15.5%) compared with metropolitan (10.1%) adults and e-cigarette use was 1.2 times higher among rural (9.1%) compared with metropolitan (7.4%) adults.
Social and economic factors showed mixed progress
Between 2021 and 2023, volunteerism increased 22%, from 23.2% to 28.3% of the population age 16 and older. Participation rose equally among both females (25.3% to 30.9%) and males (21.0% to 25.6%).
Volunteerism is strongly associated with improved well-being, as well as lower rates of high blood pressure, obesity and depression.
However, homelessness increased 16% between 2023 and 2024, from 19.4 to 22.6 people per 10,000 population, underscoring the challenges many communities face in addressing
economic and social difficulties. Thirteen states saw increases in homelessness of 16% or higher, with the largest being 114% in Illinois from 9.5 to 20.3. During the same time period, there was a national uptick in unemployment, which increased 7% from 4.3% to 4.6% of civilian workers ages 16-64.
The share of adults who avoided care due to cost increased 8%, from 10.6% to 11.5%, between 2023 and 2024. Eight states saw significant increases; the largest was 30% in Nebraska (8.8% to 11.4%).
“The data contained in this report provide a clear roadmap, helping public health leaders identify what’s working, where progress is needed and how to transform insight into measurable and meaningful improvement.”
– Joseph Kanter, MD, MPH, CEO, Association of State and Territorial Health Officials
To advance health and well-being nationwide, community and health leaders alike can use the data in this report to implement data-driven solutions that build on improvements in mortality and prevention while addressing the unique challenges and gaps facing specific populations, including rural communities.
 US Summary
 Alabama
 Alaska
 Arizona
 Arkansas
 California
 Colorado
 Connecticut
 Delaware
 District of Columbia
 Florida
 Georgia
 Hawaii
 Idaho
Idaho Illinois
 Indiana
 Iowa
Iowa Kansas
 Kentucky
 Louisiana
 Maine
Maine Maryland
 Massachusetts
 Michigan
 Minnesota
 Mississippi
 Missouri
 Montana
 Nebraska
 Nevada
 New Hampshire
 New Jersey
 New Mexico
 New York
 North Carolina
 North Dakota
 Ohio
Ohio Oklahoma
 Oregon
 Pennsylvania
 Rhode Island
 South Carolina
 South Dakota
 Tennessee
 Texas
Texas Utah
Utah Vermont
 Virginia
 Washington
 West Virginia
 Wisconsin
 Wyoming