How State Rankings Were Generated
This year, 125 measures (including 83 weighted and 42 additional unweighted measures) were analyzed for the
America’s Health Rankings 2026 Health of Women and Children Report, using the most recent data available as of August 19, 2026. Data years varied by measure because of the variety of data sources. Multiple data years were combined for some measures to ensure reliable state-level estimates. Measure definitions, sources and data years are available in the Appendix:
Measures Table - Women and
Measures Table - Children. Measure changes were based on input from the
Health of Women and Children Report Advisory Committee and are detailed on the
2026 Health of Women and Children Report Measures Selection and Changes webpage.
Each state was ranked according to its value for each measure, with a rank of No. 1 assigned to the state with the healthiest value. Ties in value were assigned equal ranks. If a state value was unavailable for a measure in this edition, it was noted as missing, unavailable or suppressed. Composite scores were generated overall and by model category. The rankings show how a state compares with other states across all weighted measures.
Overall state rankings were based on 83 weighted measures that:
- Represented current population health issues.
- Had state-level data available.
- Maintained consistent measurement across all 50 states.
- Were current and regularly updated.
- Allowed for improvement over time.
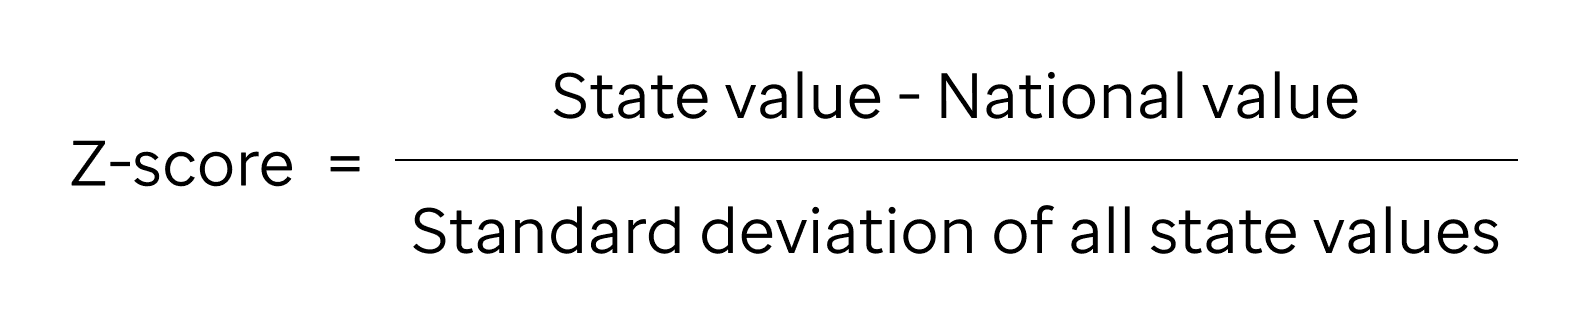
The state value for each measure was normalized into a z-score, hereafter referred to as “score,” using the following formula:
The score indicates the number of standard deviations a state value was above or below the U.S. value. Scores were capped at +/- 2.00 to prevent an extreme score from excessively influencing a state’s overall score. If a U.S. value was unavailable from the original data source for a measure, the mean of all states and the District of Columbia was used. If a value was unavailable for a state, its value from the most recent available data year was used to generate a score.
Composite scores were calculated by adding the products of the score for each measure multiplied by that measure’s assigned model weight and association with health. Measures positively associated with population health, such as adequate insurance and flu vaccination, were multiplied by 1. In contrast, measures with a negative association, such as cigarette smoking and maternal mortality, were multiplied by -1. A state that ranked No. 1 will have a higher composite score (e.g., 2.00), reflecting better health, whereas a state that ranked No. 50 will have a lower composite score (e.g., -2.00). The overall state ranks were calculated by ranking the Overall score, which included all weighted measures in the model (see
Measures, Weights and Direction for model and measure weights).
Scores and ranks were not calculated for the District of Columbia because of its unique status as an entirely urban population with different governing and funding mechanisms than states. While the District of Columbia was not included in the overall state rankings, its data are available in this report and on the America’s Health Rankings website.
This report presents long-term ranking comparisons, noting that the underlying measures and methodologies have evolved over the last decade. The model methodology changed starting with the 2020 edition, rankings were not published in the 2020 and 2021 editions, and children’s rankings did not include infant measures prior to 2020.
Findings. A decade after its first publication, this edition features long-term trends. Data for all measures were analyzed and considered for inclusion in the report. Measures with long-term trends were selected, with priority to those with updated data and/or statistically significant national changes (based on nonoverlapping 95% confidence intervals, when available). Of note, long-term trend analyses were not available for all demographic groups due to changes in methodology and/or data availability over time. Notably, income groups $75,000 and above are excluded from long-term trend comparisons.
Health Disparities. Health disparities highlight significant differences within measures based on age, disability status, education, gender, income, metropolitan status, race/ethnicity, sexual orientation, special health care needs status among children and veteran status where data were available. Health disparities are presented as a ratio calculated by dividing the value of one group by the value of another. For example, the value of the group with the highest value may be divided by the value of the group with the lowest value. Only measures with significant differences determined by nonoverlapping 95% confidence intervals were considered. The groups with the largest health disparities, considering relevant risk factors, were prioritized for inclusion. Not all statistically significant differences are detailed in the report. Full demographic data are published on the
America’s Health Rankings website. For more information, see
Disparity Measures Methodology.
This year’s State Summaries highlight ranking history over the past decade. The underlying measures and methodologies have evolved over this period. In 2020,
America’s Health Rankings introduced a
new rankings model to reflect a growing understanding of the impact of social determinants on health. Rankings were not published in the 2020 and 2021 editions, and children’s rankings did not include infant measures prior to 2020.
Strengths and Challenges represent measures with the biggest impact on a state’s overall ranking (from the 83 weighted measures). Measures with newly available data that span model categories and topic areas were given priority during selection. Unweighted measures were excluded from the ranking calculations, and the District of Columbia was assessed separately by comparing its values to those of the healthiest and least healthy states. The U.S. Summary is a reference for calculating z-scores and overall rankings, so it does not include strengths and challenges.
Key Findings highlight notable long-term trends, presented as percent changes between two time periods of interest. Only statistically significant changes determined by nonoverlapping 95% confidence intervals were considered for measures with confidence intervals. Measures without confidence intervals were considered if the change was 5% or more between the two time periods. Findings were selected to include a mix of improving and worsening measures across model categories and topic areas, as well as a mix of women’s and children’s measures.
Demographic Group Definitions
Age. Age data in this report were available for measures from the Behavioral Risk Factor Surveillance System (BRFSS), the Maternal and Child Health Bureau’s Federally Available Data (FAD), which were sourced from the National Vital Statistics System (NVSS) and the Healthcare Cost and Utilization Project (HCUP), and USDA’s National and State-Level Estimates of WIC Eligibility and Program Reach report series. BRFSS groupings in this report were limited to females of reproductive age and included the following self-reported age ranges: 18-24, 25-34 and 35-44. FAD groupings were based on maternal age and were grouped into five age ranges: <20, 20-24, 25-29, 30-34 and ≥35. WIC groupings included infants age <1 and children ages 1-4.
Disability Status. Disability status data in this report were available for measures from BRFSS. Groupings were based on responses to the questions in the core disability section. Responses of yes to the question, “Are you deaf or do you have serious difficulty hearing?” were coded as difficulty hearing. Responses of yes to the question, “Are you blind or do you have serious difficulty seeing, even when wearing glasses?” were coded as difficulty seeing. Responses of yes to the question, “Because of a physical, mental, or emotional condition, do you have serious difficulty concentrating, remembering, or making decisions?” were coded as difficulty with cognition. Responses of yes to the question, “Do you have serious difficulty walking or climbing stairs?” were coded as difficulty with mobility. Responses of yes to the question, “Do you have difficulty dressing or bathing?” were coded as difficulty with self-care. Responses of yes to the question, “Because of a physical, mental, or emotional condition, do you have difficulty doing errands alone such as visiting a doctor's office or shopping?” were coded as independent living difficulty. Responses of no or missing to all questions, with at least one response being no, were coded as without a disability. Disability groups are not mutually exclusive.
Education. Education data in this report were available for measures from BRFSS, FAD (NVSS) and the National Survey of Children’s Health (NSCH). BRFSS groupings were limited to females ages 25-44 and based on responses to the question, “What is the highest grade or year of school you completed?” Responses of grades nine through 11 were classified as less than high school. Responses of grade 12 or GED were classified as high school/GED. Responses of college or technical school (1 year to 3 years) were classified as some post-high school. Responses of college (4 years or more) were classified as college graduate. FAD (NVSS) groupings were based on the education level that best described the highest degree or level of school completed at the time of death, grouped into four categories: less than high school (no diploma), high school graduate or GED completed, some college (no degree) and college or technical school (associate degree or higher). NSCH groupings were based on the highest education completed by an adult caregiver in the child’s household, grouped into four categories: less than high school education, high school or GED diploma, some college education or an associate degree, and bachelor’s degree or higher.
Gender. This report highlights data on women and includes gender stratification (girls, boys) for youth and children’s measures as available through public data sources — even though not all people identified with these two categories. Data did not differentiate between assigned sex at birth and current gender identity. While sex and gender influence health, the current data collection practices of many national surveys limit the ability to describe the health of transgender and nonbinary individuals, especially at the state level.
Sexual Orientation. Sexual orientation data in this report were available for measures from BRFSS. Groupings were based on responses to the question, “Which of the following best represents how you think of yourself?” Responses of lesbian or gay, gay, bisexual or something else were summed and classified as LGBQ+. Responses of straight — that is, not gay — were summed and classified as straight. For BRFSS measures with 2023-2024 data years, sexual orientation data for Pennsylvania are from 2024 only, while California, Ohio, Vermont and Wyoming data are from 2023 only. See details in
Measures Selection and Changes.
Income. Income data in this report were available for measures from BRFSS and FAD (HCUP). BRFSS groupings were limited to females ages 25-44 and based on responses to the question, “[What] is your annual household income from all sources?” Responses were classified as less than $25,000, $25,000 to $49,999, $50,000 to $74,999, $75,000 to $99,999, $100,000 to $149,999 and $150,000 or more. FAD (HCUP) groupings were based on current-year ZIP code median household income and grouped into quartiles, with Quartile 1 representing the wealthiest areas and Quartile 4 the least wealthy.
Metropolitan Status. Metropolitan status data in this report were available for measures from BRFSS and FAD (HCUP). BRFSS groupings were coded based on the respondent’s residence. Identification as large central metro, large fringe metro, medium metro or small metro was classified as metropolitan, and identification as micropolitan or noncore was classified as nonmetropolitan. FAD (HCUP) groupings were based on the 2013 National Center for Health Statistics Urban-Rural Classification Scheme for Counties. Metropolitan areas with at least 1 million residents were classified as large metro. Metropolitan areas of fewer than 1 million residents were classified as small-to-medium metro. Micropolitan, nonmetropolitan and nonmicropolitan areas were classified as nonmetro.
Race/Ethnicity. Data were provided where available for the following aggregated racial and ethnic groups: American Indian/Alaska Native, Asian, Black or African American (classified in this report as Black), Hispanic or Latino/a (classified as Hispanic), Native Hawaiian or Other Pacific Islander (classified as Hawaiian/Pacific Islander), white, multiracial and those who identify as other race. Racial and ethnic groups were defined differently across data sources (details below). In summary, BRFSS, CDC WONDER, FAD, National Center for Education Statistics and National Survey of Children’s Health race groupings are all non-Hispanic, while American Community Survey data are presented as Hispanic-inclusive, except for white, which is non-Hispanic.
Racial and ethnic groups by source:
- American Community Survey: American Indian and Alaska Native; Asian; Black or African American; Hispanic or Latino Origin (any race); Native Hawaiian or Other Pacific Islander; white (non-Hispanic); two or more races; and some other race.
- BRFSS: American Indian/Alaskan Native (non-Hispanic); Asian (non-Hispanic); Black or African American (non-Hispanic); Hispanic, Latino/a or Spanish origin (any race); Native Hawaiian or Other Pacific Islander (non-Hispanic); white (non-Hispanic); and multiracial (non-Hispanic).
- CDC WONDER: American Indian or Alaska Native (non-Hispanic); Asian (non-Hispanic); Black or African American (non-Hispanic); Hispanic (any race); Native Hawaiian or Other Pacific Islander (non-Hispanic); white (non-Hispanic); and more than one race (non-Hispanic).
- FAD: American Indian/Alaska Native (non-Hispanic); Asian (non-Hispanic); Black (non-Hispanic); Hispanic (any race); Native Hawaiian/Other Pacific Islander (non-Hispanic); and white (non-Hispanic). NVSS also included multiple race (non-Hispanic), while HCUP categorized multiple race and other race as Other (Hispanic inclusive).
- National Center for Education Statistics: American Indian/Alaska Native (non-Hispanic); Asian (non-Hispanic); Black (non-Hispanic); Hispanic; Native Hawaiian/Pacific Islander (non-Hispanic); white (non-Hispanic); and multiracial (non-Hispanic).
- NSCH: American Indian/Alaskan Native (non-Hispanic); Asian (non-Hispanic); Black or African American (non-Hispanic); Hispanic (any race); Native Hawaiian or Other Pacific Islander (non-Hispanic); white (non-Hispanic); and multiple race (non-Hispanic).
Special Health Care Needs Status Among Children. Children with special health care needs status data in this report were available for measures from NSCH. For this demographic, children were grouped into two categories and classified as children with special health care needs (CSHCN) or children without special health care needs. Children were defined as having special health care needs if they either had at least one functional difficulty and one health condition (detailed in
Measures Selection and Changes) and/or met one or more of the criteria outlined in the
Children with Special Health Care Needs (CSHCN) Screener©, which
characterizes special health care needs based on the health challenges a child experiences due to an ongoing health condition, regardless of diagnosis.
63,64 The screener has five criteria: needing or using prescription medications; needing or using medical, mental health or educational services more than average; having functional limitations compared with children of the same age; using or needing specialized therapies, such as speech therapy or occupational therapy; or receiving treatment or counseling for emotional, behavioral or developmental problems.
Veteran Status. Veteran status data in this report were available for measures from BRFSS. Groupings were based on responses to the question, “Have you ever served on active duty in the United States Armed Forces, either in the regular military or in a National Guard or military reserve unit?” Responses of yes were summed and classified as served. Responses of no were summed and classified as not served.
Rankings are a relative measure of health. Not all changes in rank translate into actual declines or improvements in health. Data presented in this report were aggregated at the state level and cannot be used to make inferences at the individual level. Additionally, estimates cannot be extrapolated beyond the population upon which they were created. Values and ranks from prior years have been updated on the America’s Health Rankings website to reflect known errors and updates from the reporting source.
Use caution when interpreting data, as many measures are self-reported and rely on an individual’s perception of health and behaviors. Additionally, some health outcome measures are based on respondents being told by a health care professional that they have a disease and may exclude those who have not received a diagnosis or sought or obtained treatment.
This report provides health disparity data on various demographic group characteristics alongside socioeconomic factors and environmental influences. Relying solely on health disparity data may lead to misinterpretations of health outcomes, as they do not account for the
social drivers that significantly impact individuals’ access to care, quality of life and overall well-being.
65 Inclusivity in data collection is essential to documenting, analyzing and addressing the health disparities people experience.
Equitable systems must accurately represent diverse populations throughout the data life cycle, from data collection through analysis to interpretation.
66 Inadequate representation of populations may hinder the identification of trends and patterns within different demographic groups and limit the ability to tailor public health interventions and personalize care that empowers people to make better health choices.

 US Summary
 Alabama
 Alaska
 Arizona
 Arkansas
 California
 Colorado
 Connecticut
 Delaware
 District of Columbia
 Florida
 Georgia
 Hawaii
 Idaho
Idaho Illinois
 Indiana
 Iowa
Iowa Kansas
 Kentucky
 Louisiana
 Maine
Maine Maryland
 Massachusetts
 Michigan
 Minnesota
 Mississippi
 Missouri
 Montana
 Nebraska
 Nevada
 New Hampshire
 New Jersey
 New Mexico
 New York
 North Carolina
 North Dakota
 Ohio
Ohio Oklahoma
 Oregon
 Pennsylvania
 Rhode Island
 South Carolina
 South Dakota
 Tennessee
 Texas
Texas Utah
Utah Vermont
 Virginia
 Washington
 West Virginia
 Wisconsin
 Wyoming