Cigarette Smoking Among Women
As the
leading cause of preventable death in the U.S., cigarette smoking is responsible for the deaths of more than 470,000 Americans every year, including 196,200 women.
59 Smoking affects
nearly every organ and can cause cancer, heart disease, stroke, diabetes and respiratory conditions such as chronic obstructive pulmonary disease (COPD).
60 In the decade between 2013-2014 and 2023-2024, cigarette smoking significantly decreased:
- 74% among women ages 18-24 (14.4% to 3.7%), 60% among women ages 25-34 (19.7% to 7.9%) and 28% among women ages 35-44 (17.3% to 12.4%).
- 53% among white (21.9% to 10.4%), 52% among Asian (4.8% to 2.3%), 48% among Black (15.7% to 8.1%), 44% among American Indian/Alaska Native (33.1% to 18.7%) and 42% among Hispanic (8.8% to 5.1%) women.
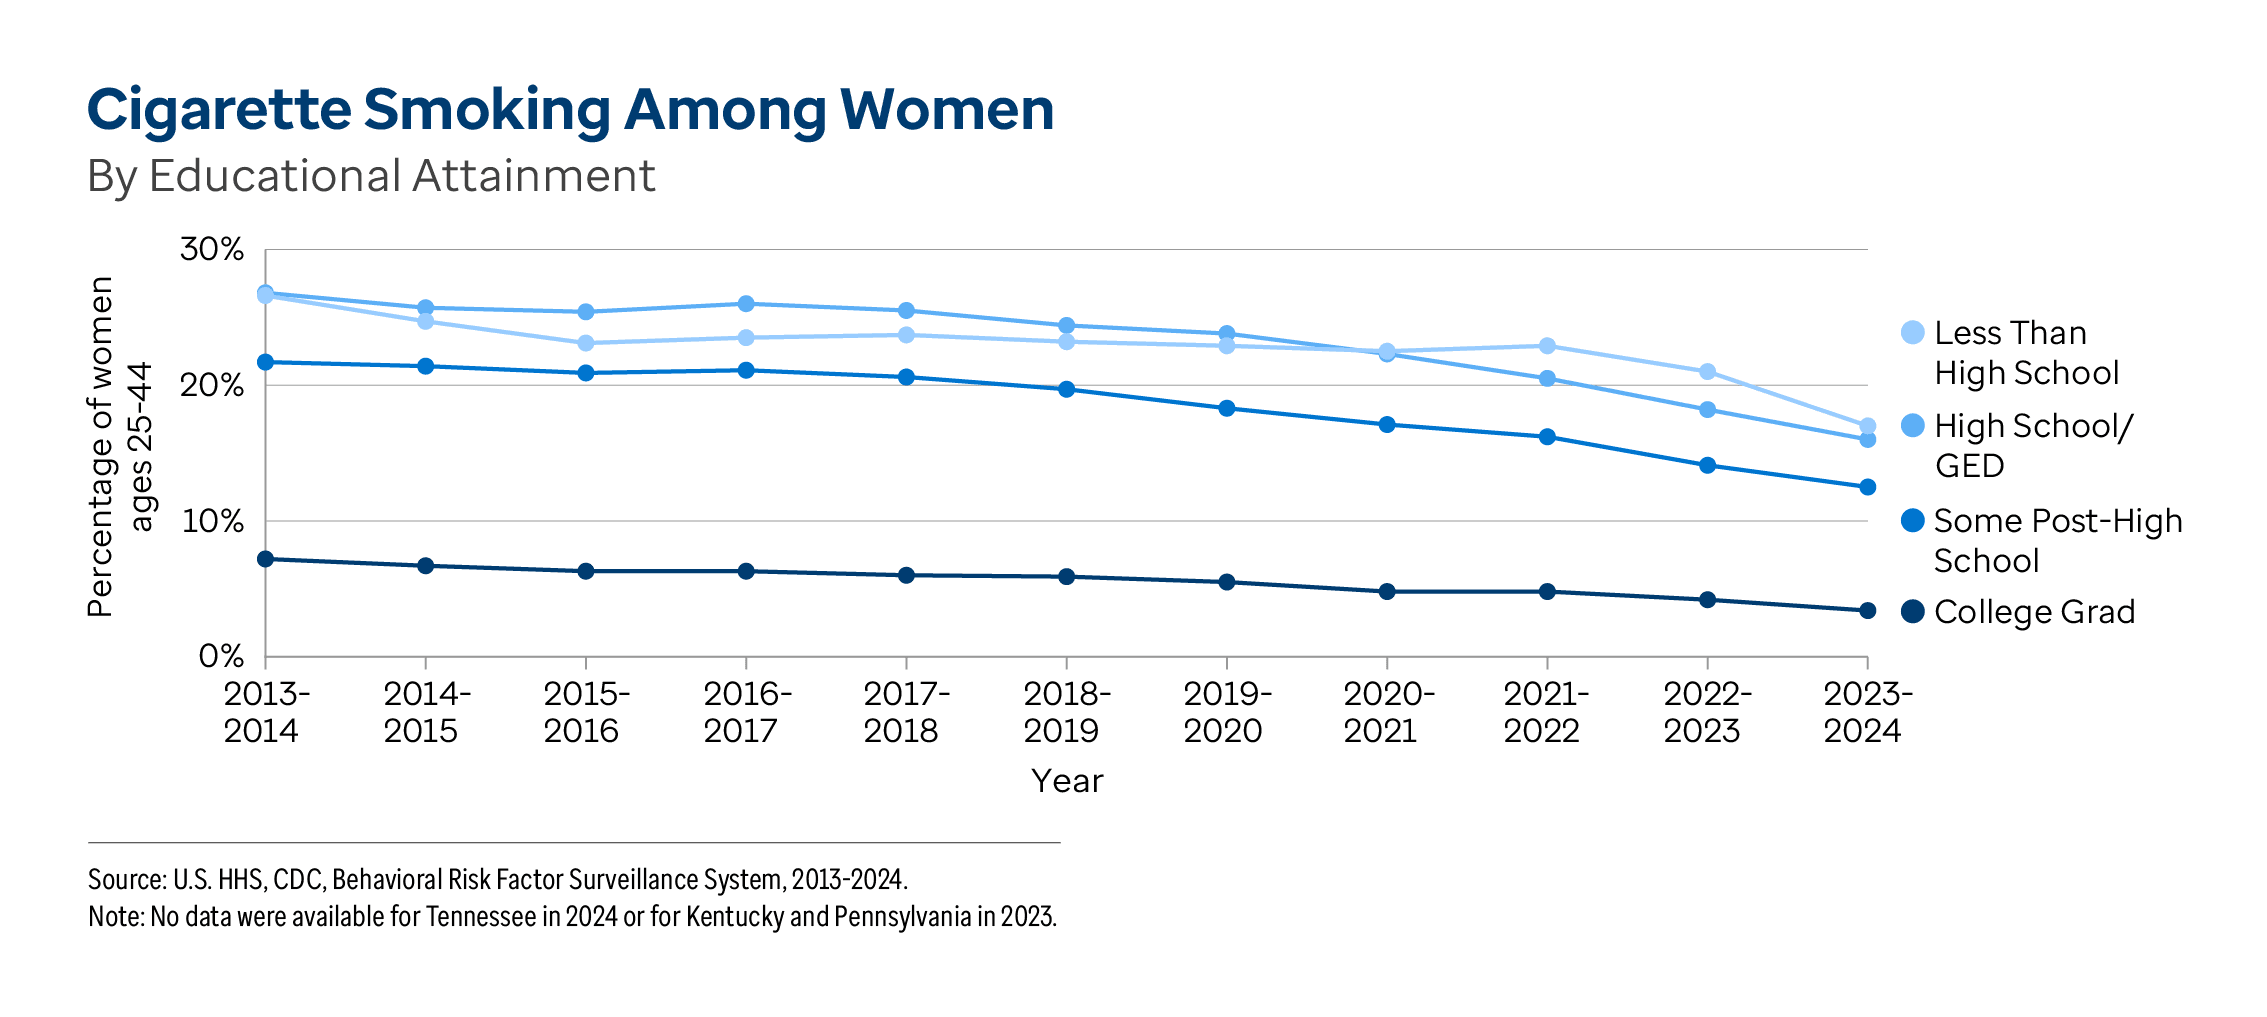
- 53% among college graduates (7.2% to 3.4%), 42% among women with some post-high school education (21.7% to 12.5%), 40% among high school graduates (26.8% to 16.0%) and 36% among women with less than a high school education (26.6% to 17.0%).
- 33% among women with an annual household income less than $25,000 (28.4% to 18.9%), 32% among women with an income of $50,000 to $74,999 (14.6% to 10.0%) and 29% among women with an income of $25,000 to $49,999 (19.9% to 14.1%).
During the same time period, the prevalence significantly decreased in 49 states and the District of Columbia. The largest decreases were 69% in the
District of Columbia (14.0% to 4.3%), 65% in
Connecticut (15.6% to 5.5%) and 64% in
Rhode Island (18.1% to 6.6%).
Recent differences. The prevalence of cigarette smoking significantly varied by race/ethnicity, geography, income, educational attainment, disability status, age, metropolitan status and sexual orientation. In 2023-2024, the prevalence among women ages 18-44 was:
- 8.1 times higher among American Indian/Alaska Native (18.7%) compared with Asian (2.3%) women.
- 6.1 times higher in West Virginia (22.7%) than in Utah (3.7%).
- 5.9 times higher among women with an annual household income less than $25,000 (18.9%) compared with women with an income of $150,000 or more (3.2%).
- 5.0 times higher among women with less than a high school education (17.0%) compared with college graduates (3.4%).
- 3.9 times higher among women with difficulty with self-care (23.6%) compared with women without a disability (6.0%).
- 3.4 times higher among women ages 35-44 (12.4%) compared with women ages 18-24 (3.7%).
- 1.9 times higher among women living in nonmetropolitan areas (14.4%) compared with women in metropolitan areas (7.5%).
- 1.3 times higher among LGBQ+ women (11.1%) compared with straight women (8.4%).
Note: No data were available for Tennessee in 2024 or for Kentucky and Pennsylvania in 2023. Differences highlight the groups with the highest and lowest values. However, the values for certain race/ethnicity, education and disability groups may not differ significantly based on overlapping 95% confidence intervals. For more information, view
cigarette smoking data for women.
Related Measure: Household SmokeNationally, the prevalence of
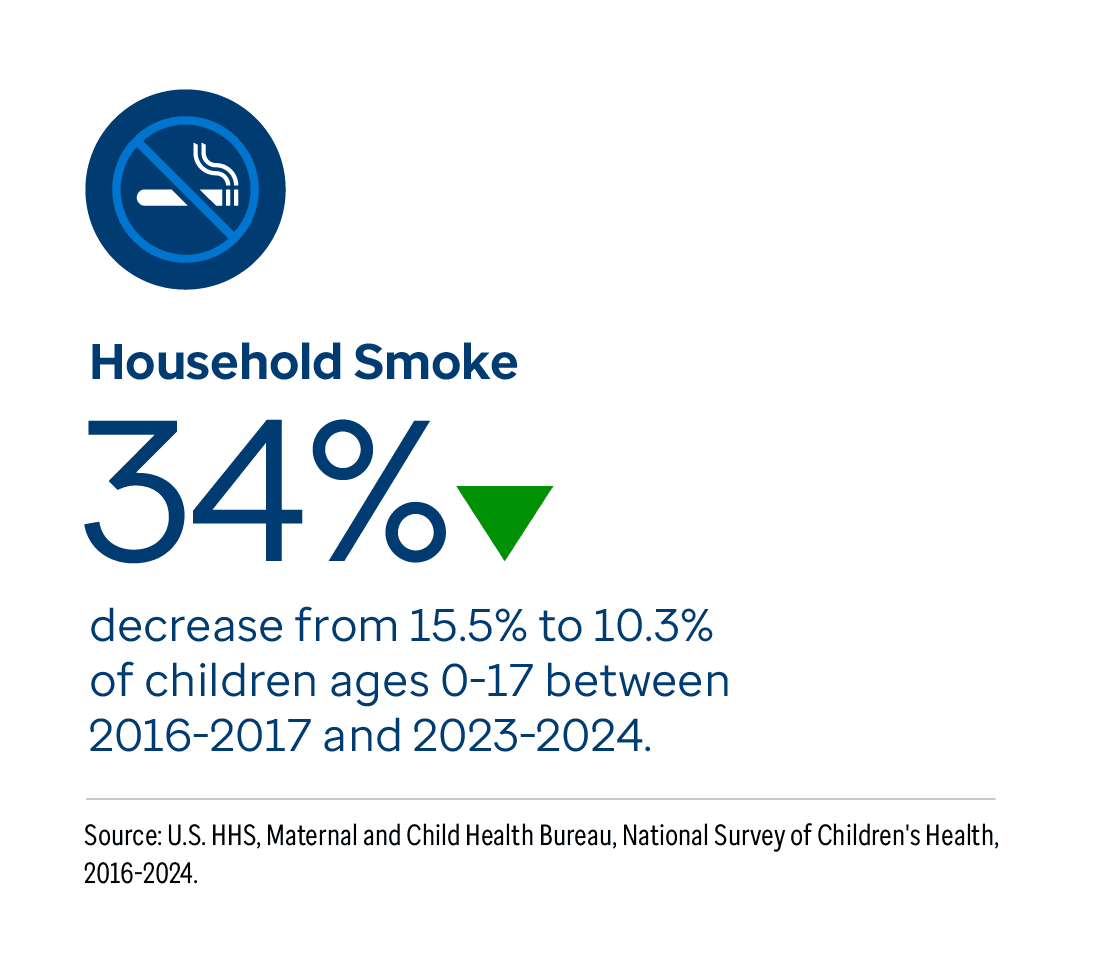
household smoke — the percentage of children ages 0-17 who live in households where someone uses cigarettes, cigars or pipe tobacco — decreased 34% from 15.5% to 10.3% between 2016-2017 and 2023-2024. In 2023-2024, 7.2 million children ages 0-17 lived in a household with smoke, a decrease of 3.9 million children compared with 2016-2017.
Between 2016-2017 and 2023-2024, the prevalence of household smoke among children ages 0-17 significantly decreased in 26 states. The largest decreases were 47% in
California (11.0% to 5.8%), 46% in
Colorado (14.3% to 7.7%) and 45% in
Nebraska (18.4% to 10.2%). In 2023-2024, the prevalence was 4.7 times higher in
West Virginia (21.9%) than in
Utah (4.7%). The prevalence of household smoke also significantly varied by education, race/ethnicity and children with special health care needs. For more information, view
household smoke data for children.
E-Cigarette Use Among Women
Electronic cigarettes, also called
e-cigarettes, vapes or vape pens, are electronic devices that use heat to make an aerosol that the user inhales.
62 The aerosol produced by e-cigarettes contains
toxic substances that can cause cancer and serious lung disease.
62 Changes over time. Nationally, the prevalence of
e-cigarette use — the percentage of women ages 18-44 who reported using e-cigarettes or other electronic vaping products at least once in their lifetime and now use daily or some days — increased 121% from 5.3% to 11.7% between 2018 and 2023-2024. In 2023-2024, 6.2 million women reported using e-cigarettes, an increase of nearly 4.1 million women compared with 2018.
Between 2018 and 2023-2024, e-cigarette use among women ages 18-44 significantly increased:
- 298% among Hawaiian/Pacific Islander (5.4% to 21.5%), 272% among Asian (1.8% to 6.7%), 143% among American Indian/Alaska Native (6.0% to 14.6%), 134% among Hispanic (3.2% to 7.5%), 131% among Black (3.5% to 8.1%), 116% among white (6.9% to 14.9%) and 97% among multiracial (9.5% to 18.7%) women.
- 205% among women with an annual household income of $50,000 to $74,999 (3.8% to 11.6%), 157% among women with an income of $25,000 to $49,999 (5.1% to 13.1%) and 84% among women with an income less than $25,000 (6.4% to 11.8%).
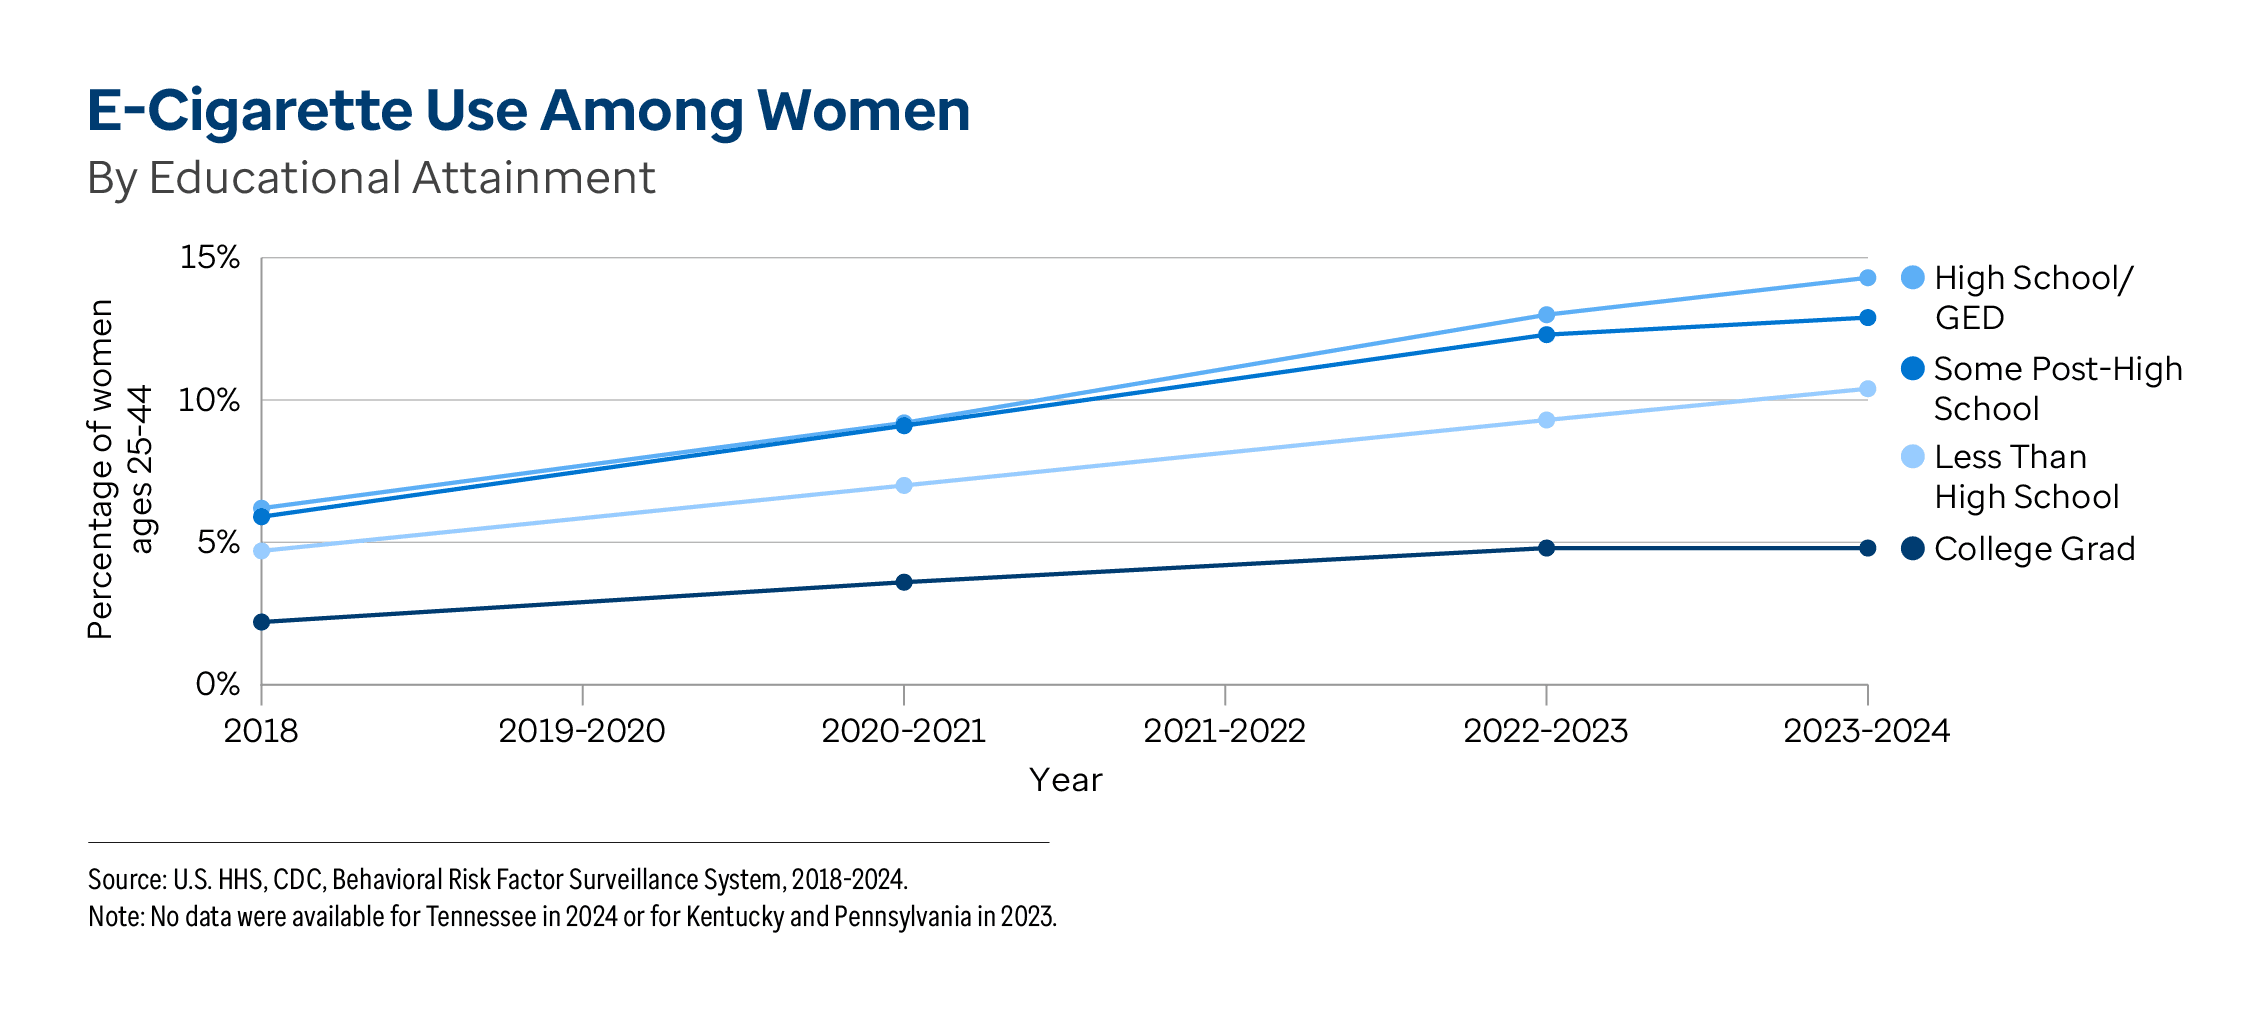
- 131% among high school graduates (6.2% to 14.3%), 121% among women with less than a high school education (4.7% to 10.4%), 119% among women with some post-high school education (5.9% to 12.9%) and 118% among college graduates (2.2% to 4.8%).
- 130% among women ages 25-34 (5.0% to 11.5%), 125% among women ages 18-24 (7.6% to 17.1%) and 100% among women ages 35-44 (4.0% to 8.0%).
During the same time period, the prevalence significantly increased in 48 states. The largest increases were 218% in
Pennsylvania (3.9% to 12.4%), 216% in
Louisiana (5.6% to 17.7%) and 209% in
Kansas (4.7% to 14.5%).
Recent differences. The prevalence of e-cigarette use significantly varied by race/ethnicity, educational attainment, disability status, geography, income, age, sexual orientation, metropolitan status, and veteran status. In 2023-2024, the prevalence among women ages 18-44 was:
- 3.2 times higher among Hawaiian/Pacific Islander (21.5%) compared with Asian (6.7%) women.
- 3.0 times higher among high school graduates (14.3%) compared with college graduates (4.8%).
- 2.9 times higher among women with independent living difficulty (25.0%) compared with women without a disability (8.5%).
- 2.6 times higher in West Virginia (19.5%) than in Maryland (7.6%).
- 2.5 times higher among women with an annual household income of $25,000 to $49,999 (13.1%) compared with women who have an income of $150,000 or more (5.2%).
- 2.1 times higher among women ages 18-24 (17.1%) compared with women ages 35-44 (8.0%).
- 2.0 times higher among LGBQ+ women (20.1%) compared with straight women (9.9%).
- 1.5 times higher among women living in nonmetropolitan areas (16.7%) compared with women in metropolitan areas (11.0%).
- 1.3 times higher among women who have served in the U.S. armed forces (15.0%) compared with women who have not served (11.6%).
Note: No data were available for Tennessee in 2024 or for Kentucky and Pennsylvania in 2023. Differences highlight the groups with the highest and lowest values. However, the values for certain race/ethnicity, educational attainment, disability and income groups may not differ significantly based on overlapping 95% confidence intervals. For more information, view
e-cigarette use data for women.
Related Measure: Electronic Vapor Product Use Among YouthNationally, the prevalence of
electronic vapor product use — the percentage of high school students who reported using an electronic vapor product in the past 30 days — decreased 49% from 32.7% to 16.8% between 2019 and 2023. During the same time period, electronic vapor product use decreased in 15 states. The largest decreases were 60% in
Nebraska (17.1% to 6.9%), 59% in
Virginia (19.9% to 8.1%) and 57% in
Hawaii (30.6% to 13.2%). In 2023, the prevalence among high school students was 4.3 times higher in
Montana (24.3%) than in
Utah (5.7%).

 US Summary
 Alabama
 Alaska
 Arizona
 Arkansas
 California
 Colorado
 Connecticut
 Delaware
 District of Columbia
 Florida
 Georgia
 Hawaii
 Idaho
Idaho Illinois
 Indiana
 Iowa
Iowa Kansas
 Kentucky
 Louisiana
 Maine
Maine Maryland
 Massachusetts
 Michigan
 Minnesota
 Mississippi
 Missouri
 Montana
 Nebraska
 Nevada
 New Hampshire
 New Jersey
 New Mexico
 New York
 North Carolina
 North Dakota
 Ohio
Ohio Oklahoma
 Oregon
 Pennsylvania
 Rhode Island
 South Carolina
 South Dakota
 Tennessee
 Texas
Texas Utah
Utah Vermont
 Virginia
 Washington
 West Virginia
 Wisconsin
 Wyoming