Changes over the last decade. Nationally, the
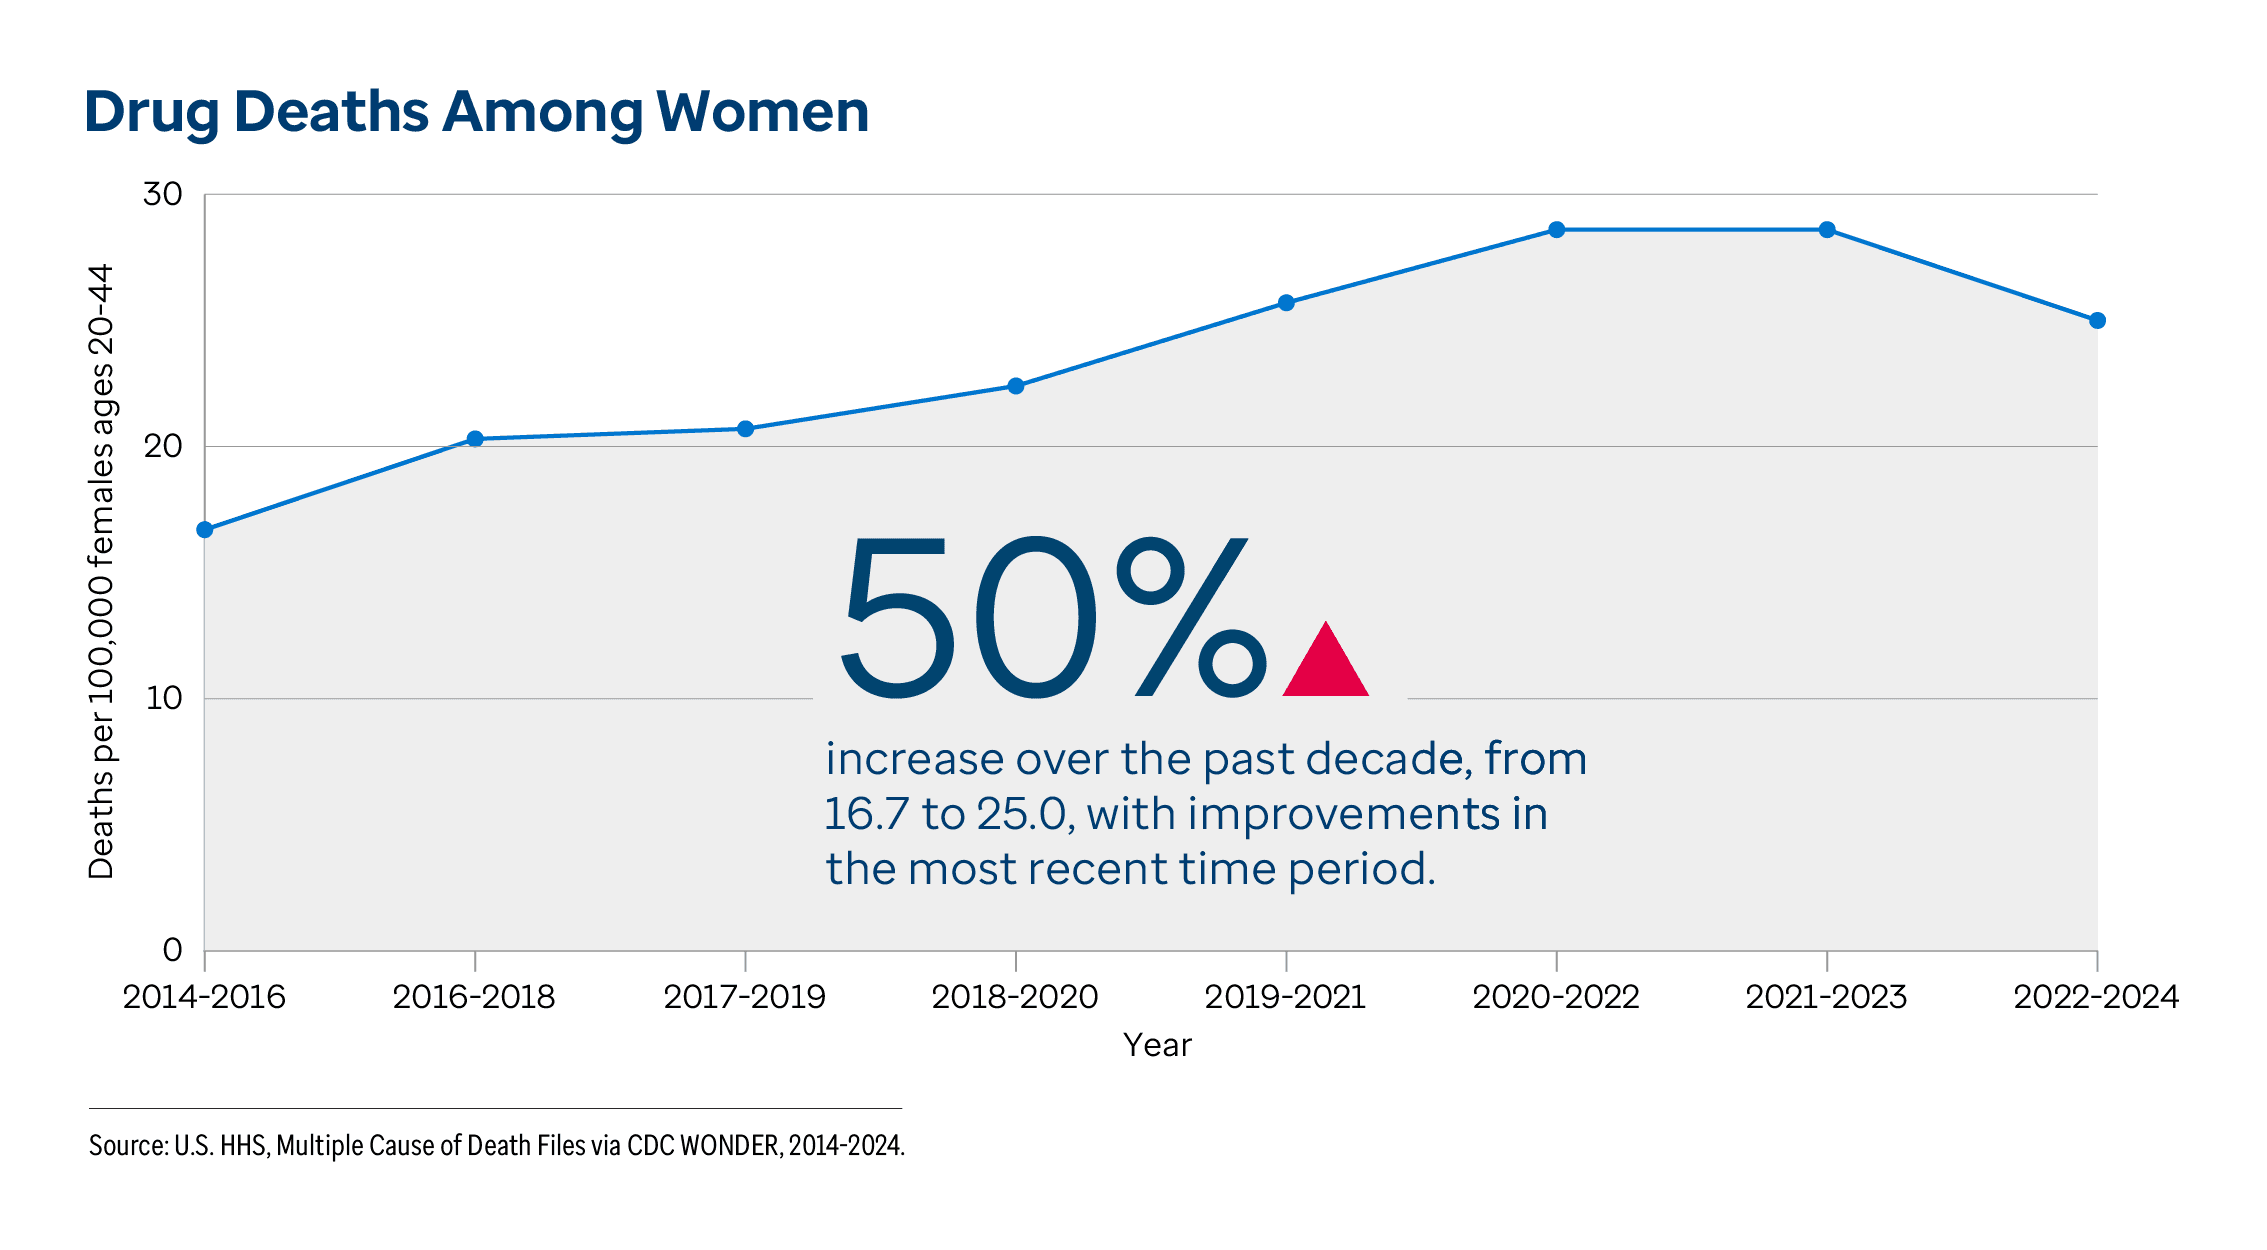
drug death rate — the number of deaths due to drug injury (unintentional, suicide, homicide or undetermined) per 100,000 women ages 20-44 — increased 50% from 16.7 to 25.0 between 2014-2016 and 2022-2024. However, for the first time in a decade, the rate decreased 3% (from 25.7 deaths per 100,000 women ages 20-44) between 2019-2021 and 2022-2024. Despite this decrease, the rate remains above the
Healthy People 2030 target of 20.7 drug overdose deaths per 100,000 population.
4 Reducing drug overdose deaths is a Healthy People 2030
Leading Health Indicator.
5 In 2022-2024, 41,700 women ages 20-44 in the U.S. died from a drug overdose, an increase of 15,000 deaths compared with 2014-2016.
In the decade between 2014-2016 and 2022-2024, the drug death rate significantly decreased 26% in
Utah (23.9 to 17.7 deaths per 100,000 women ages 20-44) and increased in 38 states and the District of Columbia. The largest increases were 360% in the
District of Columbia (4.3 to 19.8), 185% in
North Dakota (9.2 to 26.2), 170% in
Alaska (19.6 to 53.0) and 132% in
Oregon (11.4 to 26.5).
In the period between 2018-2020 and 2022-2024, the drug death rate significantly increased 75% among
American Indian/Alaska Native (42.9 to 74.9 deaths per 100,000 women ages 20-44), 57% among
Black (19.2 to 30.2), 40% among
Hispanic (9.2 to 12.9), 36% among
multiracial (15.2 to 20.7) and 26% among
Asian (2.7 to 3.4) women but remained stable among
white women (30.7 to 30.9).
Recent differences. The drug death rate varied by race/ethnicity, geography and age. In 2022-2024, the rate was:
- 22.0 times higher among American Indian/Alaska Native (74.9 deaths per 100,000 women ages 20-44) compared with Asian (3.4) women.
- 7.4 times higher in West Virginia (75.2) than in Nebraska (10.2).
- 2.7 times higher among women ages 35-44 (32.7) compared with women ages 20-24 (11.9).
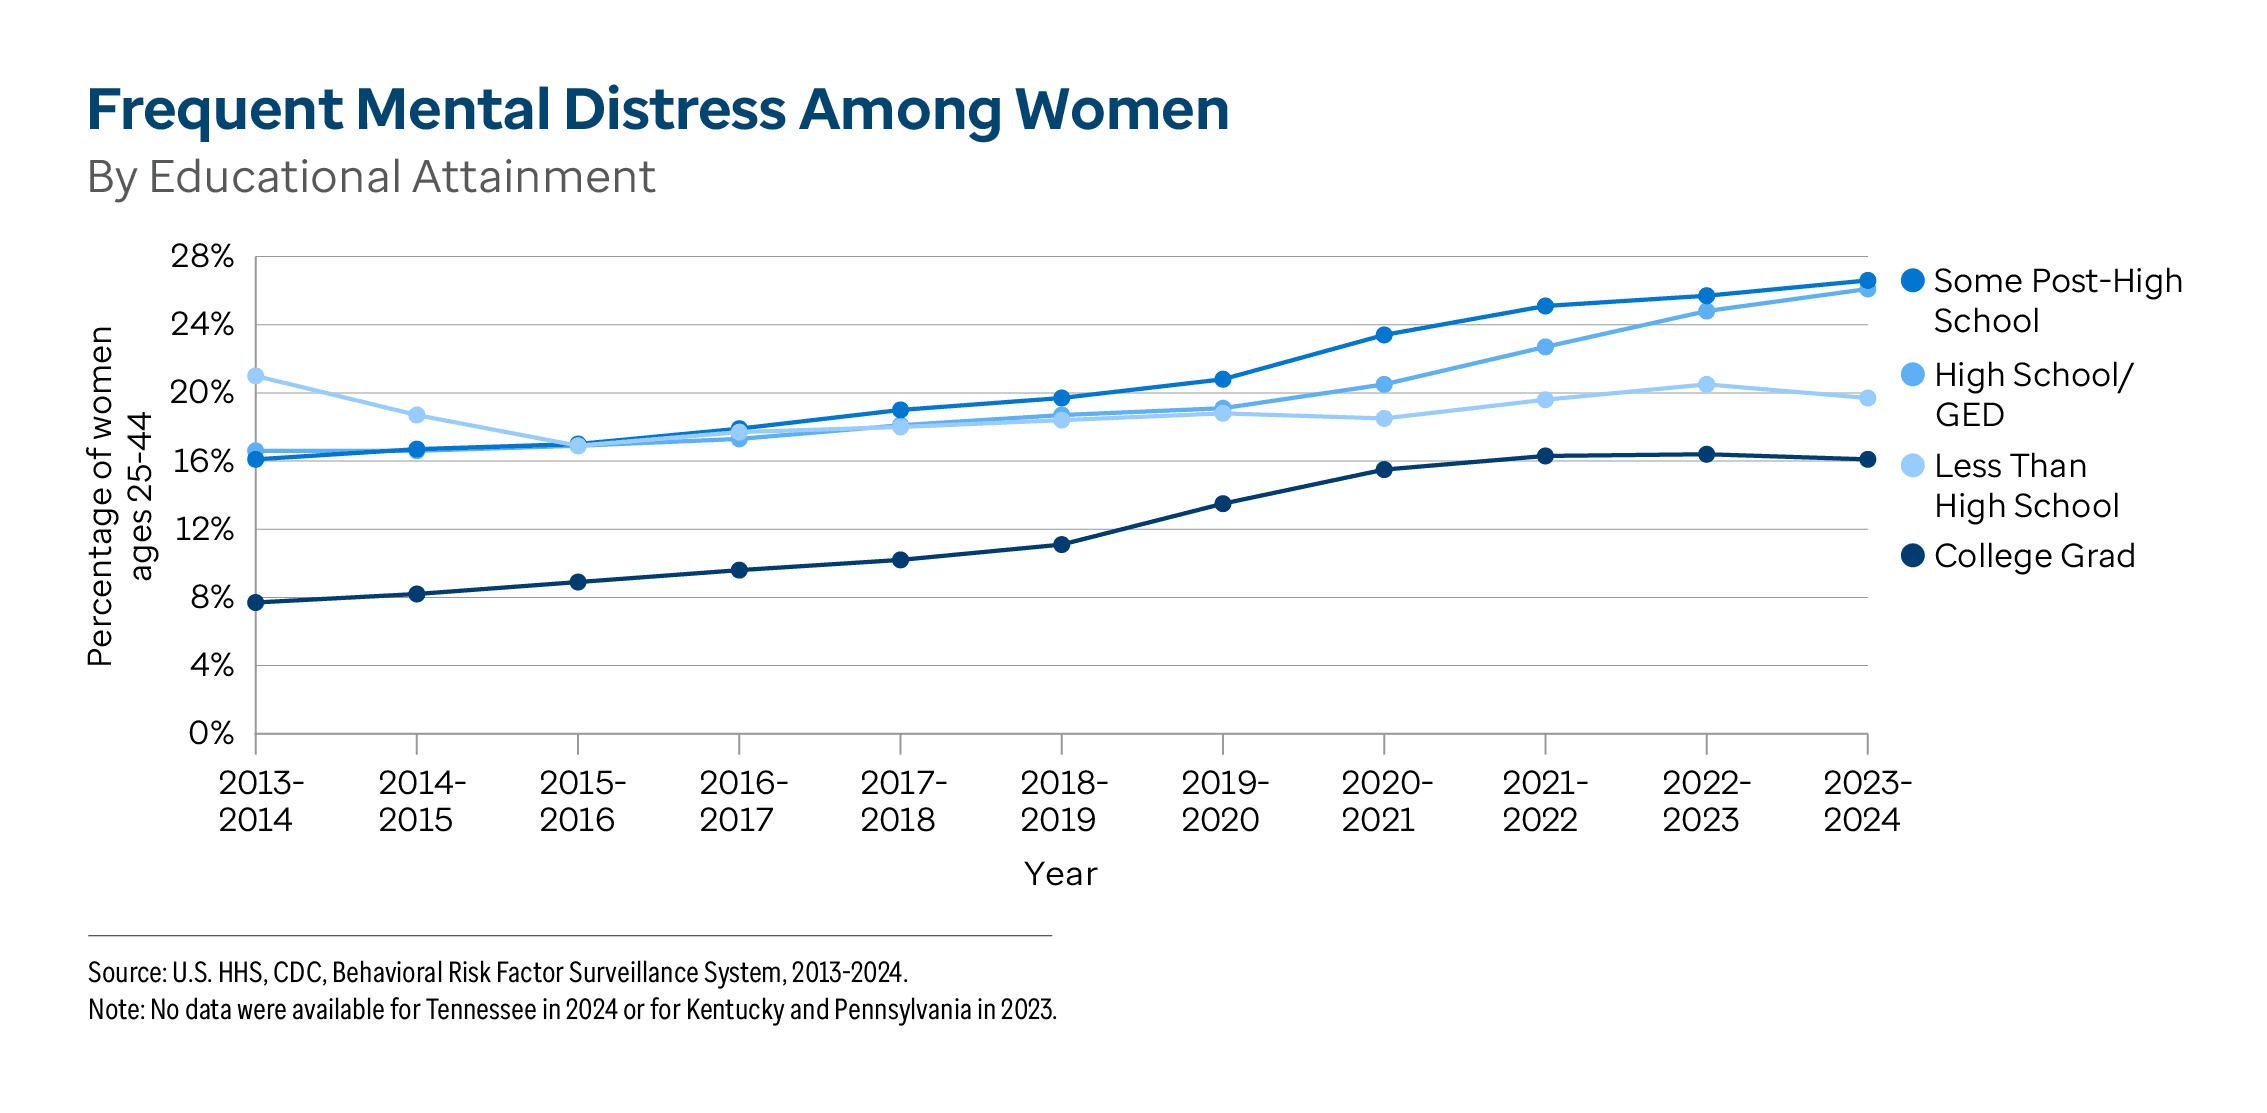
Frequent Mental Distress Among Women
Although occasional short periods of mental distress and a few bad mental health days may be unavoidable, more prolonged and severe episodes are treatable and potentially
preventable through early intervention.
6 Changes over the last decade. Nationally, the prevalence of
frequent mental distress — the percentage of women ages 18-44 who reported their mental health was not good 14 or more days in the past 30 days — increased 62% from 14.3% to 23.2% between 2013-2014 and 2023-2024. In 2023-2024, 13.3 million women ages 18-44 experienced frequent mental distress, an increase of 5.2 million women compared with 2013-2014.
In the decade between 2013-2014 and 2023-2024, frequent mental distress among women ages 18-44 significantly increased:
During the same time period, the prevalence of frequent mental distress significantly increased in 49 states and the District of Columbia. The largest increases were 146% in
North Dakota (9.4% to 23.1%), 145% in
Montana (12.1% to 29.7%) and 117% in
Nevada (13.2% to 28.6%).
Recent differences. The prevalence of frequent mental distress significantly varied by disability status, income, race/ethnicity, sexual orientation, geography, educational attainment, age, veteran status and metropolitan status. In 2023-2024, the prevalence among women ages 18-44 was:
Note: No data were available for Tennessee in 2024 or for Kentucky and Pennsylvania in 2023. Differences highlight the groups with the highest and lowest values. However, the values for certain disability, income, race/ethnicity and educational attainment groups may not differ significantly based on overlapping 95% confidence intervals. For more information, view
frequent mental distress data for women.Nationally, the prevalence of
depression — the percentage of women ages 18-44 who reported being told by a health professional that they had a depressive disorder, including depression, major depression, minor depression or dysthymia — increased 23% from 24.8% to 30.6% between 2017-2018 and 2023-2024. In the more recent period between 2021-2022 and 2023-2024, the prevalence of depression increased 5% (from 29.1%). In 2023-2024, 17.7 million women ages 18-44 reported having depression.
Between 2017-2018 and 2023-2024, the prevalence of depression among women ages 18-44 significantly increased in 32 states and the District of Columbia. The largest increases were 51% in
Texas (20.0% to 30.1%), 49% in
Nevada (18.1% to 26.9%) and 41% in
Colorado (24.1% to 34.0%). In 2023-2024, the prevalence among women ages 18-44 was 2.4 times higher in
West Virginia (47.4%) than in
New Jersey (19.4%). The prevalence of depression also significantly varied by disability status, race/ethnicity, sexual orientation, education, income, age, metropolitan status and veteran status. For more information, view
depression data for women.
Postpartum Anxiety and Depression
In 2023, 11.9% of women with a recent live birth (more than 318,000 women) reported experiencing depression symptoms, or
postpartum depression. During the same year, 20.3% of women with a recent live birth (more than 544,000 women) reported experiencing anxiety symptoms, or
postpartum anxiety.
Note: No depression data were available for Tennessee in 2024 or for Kentucky and Pennsylvania in 2023. No postpartum anxiety or postpartum depression data were available for California, Idaho, North Carolina or Ohio in 2023.
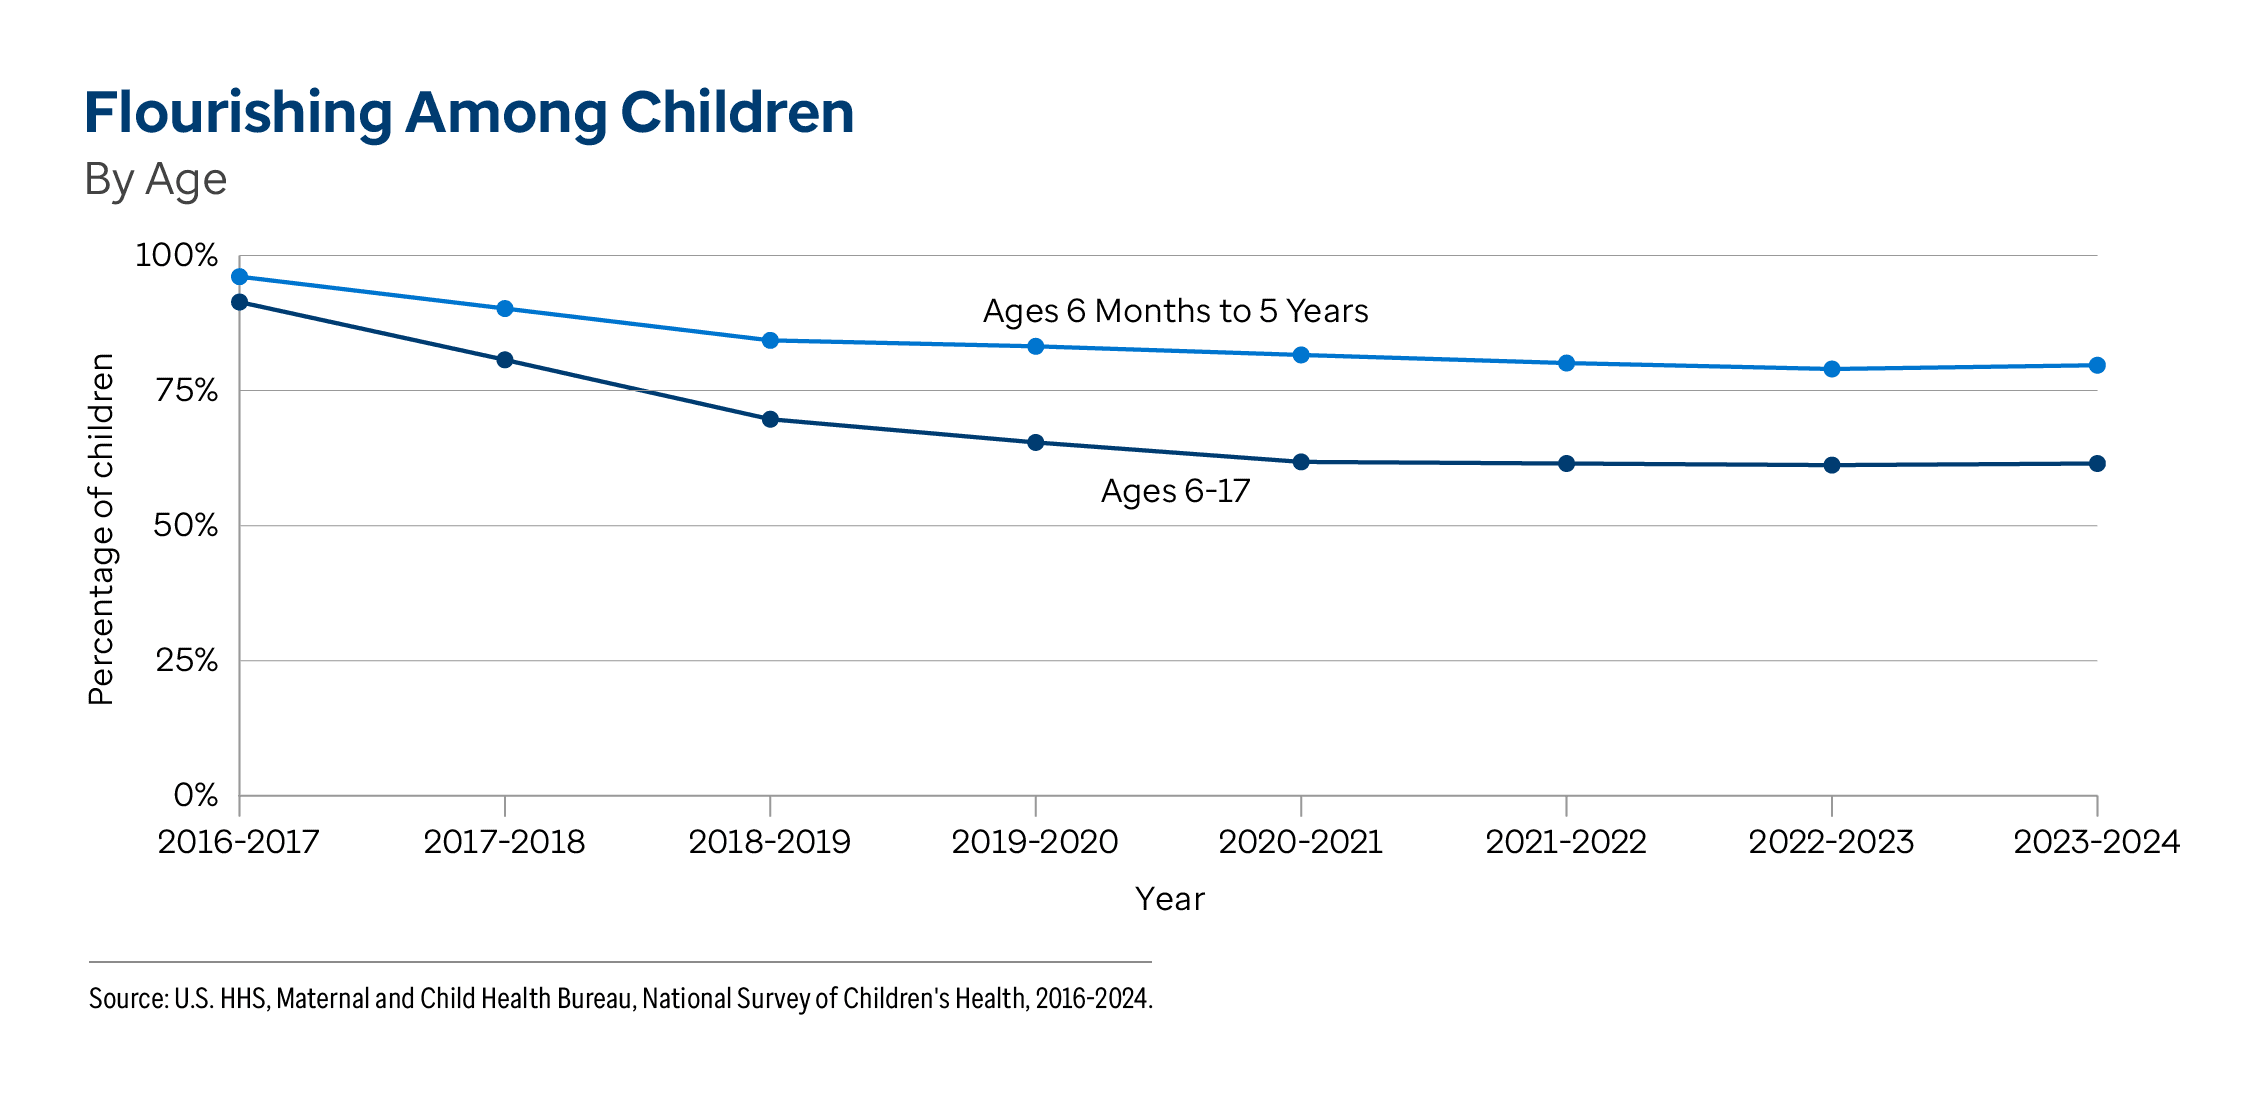
Flourishing Among Children
Flourishing measures how well children are thriving within their family and community.
7 It represents socialization, curiosity, resilience and self-regulation.
Changes over time. Nationally,
flourishing — the percentage of children ages 6 months to 5 years who show affection, resilience, interest and curiosity in learning, as well as smile and laugh a lot; and children ages 6-17 who show self-regulation, interest and curiosity in learning, as well as work to finish tasks — decreased 28% from 92.8% to 66.7% between 2016-2017 and 2023-2024. In 2023-2024, 46.6 million children were flourishing, nearly 20 million fewer than in 2016-2017.
Between 2016-2017 and 2023-2024, flourishing significantly decreased:
During the same time period, flourishing significantly decreased in all states and the District of Columbia. The largest decreases were 33% in
Maine (94.0% to 62.9%),
Oregon (92.7% to 62.0%) and
South Dakota (94.0% to 62.9%).
Recent differences. In 2023-2024, flourishing was:
- 1.8 times higher among children without special health care needs (75.7%) than those with special health care needs (43.2%).
- 1.3 times higher among children ages 6 months to 5 years (79.7%) than those ages 6-17 (61.5%).
- 1.1 times higher in Nebraska (70.1%) than in Oregon (62.0%); among girls (69.1%) than boys (64.5%); among Asian (73.3%) than Black (64.0%) children; and among children with a caregiver who graduated from college (69.7%) compared with those whose caregivers have less than a high school education (61.1%).
Note: Differences highlight the groups with the highest and lowest values. However, the values for certain race/ethnicity and educational attainment groups may not differ significantly based on overlapping 95% confidence intervals. For more information, view
flourishing data.
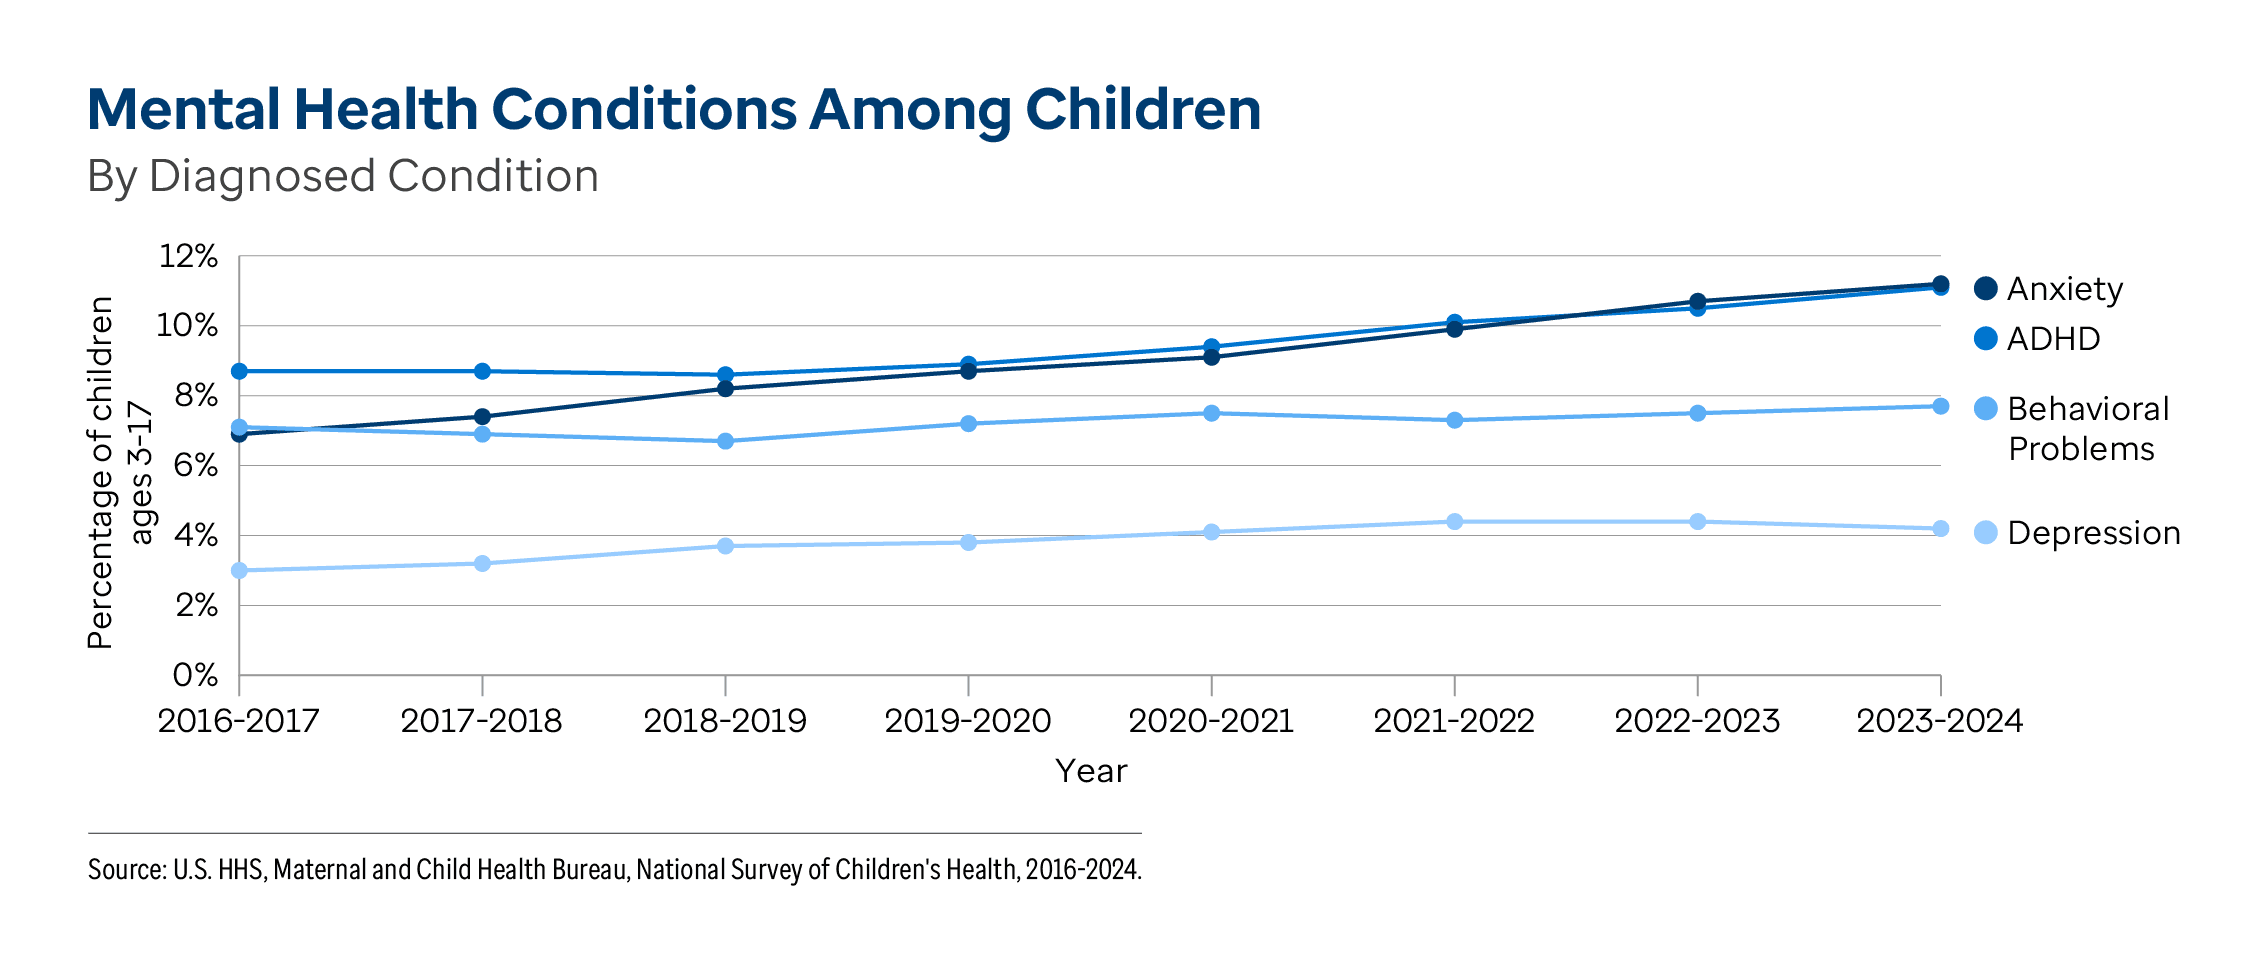
Mental Health Conditions Among Children
Changes over time. Nationally, the prevalence of
mental health conditions — the percentage of children ages 3-17 with a diagnosed mental health condition — increased 32% from 15.5% to 20.5% between 2016-2017 and 2023-2024. This includes children who received diagnoses from a health care provider for attention-deficit/hyperactivity disorder (ADHD), depression or anxiety problems, as well as those who were told by a doctor or educator that they had behavior or conduct problems. There were increases in the prevalence of
ADHD (28%, from 8.7% to 11.1%),
anxiety (62%, from 6.9% to 11.2%) and
depression (40%, from 3.0% to 4.2%). The prevalence of
behavioral problems (7.7%) did not significantly change. In 2023-2024, nearly 12.4 million children were diagnosed with a mental health condition, an increase of 3 million children compared with 2016-2017.
Between 2016-2017 and 2023-2024, the prevalence of mental health conditions among children ages 3-17 significantly increased:
During the same time period, the prevalence of mental health conditions significantly increased in 18 states. The largest increases were 71% in
New York (11.5% to 19.7%), 63% in
Oregon (16.0% to 26.0%) and 61% in
South Dakota (13.0% to 20.9%).
Recent differences. The prevalence of mental health conditions significantly varied by special health care needs status, race/ethnicity, geography, caregiver educational attainment and gender. In 2023-2024, the prevalence among children ages 3-17 was:
- 10.3 times higher among children with special health care needs (55.6%) compared with children without special health care needs (5.4%).
- 3.5 times higher among American Indian/Alaska Native (28.7%) compared with Asian (8.1%) children.
- 2.2 times higher in Maine (28.5%) than in Hawaii (13.1%).
- 1.5 times higher among children whose caregivers have some post-high school education (23.1%) compared with children whose caregivers have less than a high school education (15.9%).
- 1.2 times higher among boys (22.0%) compared with girls (18.9%).
Note: Differences highlight the groups with the highest and lowest values. However, the values for certain race/ethnicity groups may not differ significantly based on overlapping 95% confidence intervals. For more information, view
mental health conditions data for children.
Related Measure: Teen SuicideNationally, the
teen suicide rate — the number of deaths due to intentional self-harm per 100,000 adolescents ages 15-19 — increased 15% from 8.4 to 9.7 in the 10 years between 2012-2014 and 2022-2024. However, the teen suicide rate improved 8% in 2022-2024 (down from 10.6 in 2019-2021).
In the decade between 2012-2014 and 2022-2024, the teen suicide rate significantly increased in three states: 62% in
Georgia (6.8 to 11.0 deaths per 100,000 adolescents ages 15-19), 41% in
Ohio (7.4 to 10.4) and 30% in
Texas (8.7 to 11.3). In 2022-2024, the rate was 6.5 times higher in
Alaska (29.7) than in
Massachusetts (4.6). The teen suicide rate also significantly varied by race/ethnicity and gender. For more information, view
teen suicide data.
"Improving maternal and infant health requires both ensuring women can access high-quality clinical care when they need it and strengthening the supports that shape health beyond the clinic or hospital."
– Michael Warren, MD, MPH, FAAP, Chief Medical and Health Officer, March of Dimes
The majority of maternal deaths resulting from pregnancy-related complications are
preventable.
10 Despite this, the U.S. consistently has the
highest rate of maternal mortality among high-income countries.
11 The
leading causes of pregnancy-related deaths in the U.S. in 2024 according to death records were cardiovascular conditions, other noncardiovascular medical conditions (endocrine, hematologic, immunologic and renal), and infection or sepsis.
12 Maternal Mortality Review Committees, which have access to clinical and nonclinical data, have identified
mental health conditions as a leading cause of pregnancy-related deaths.
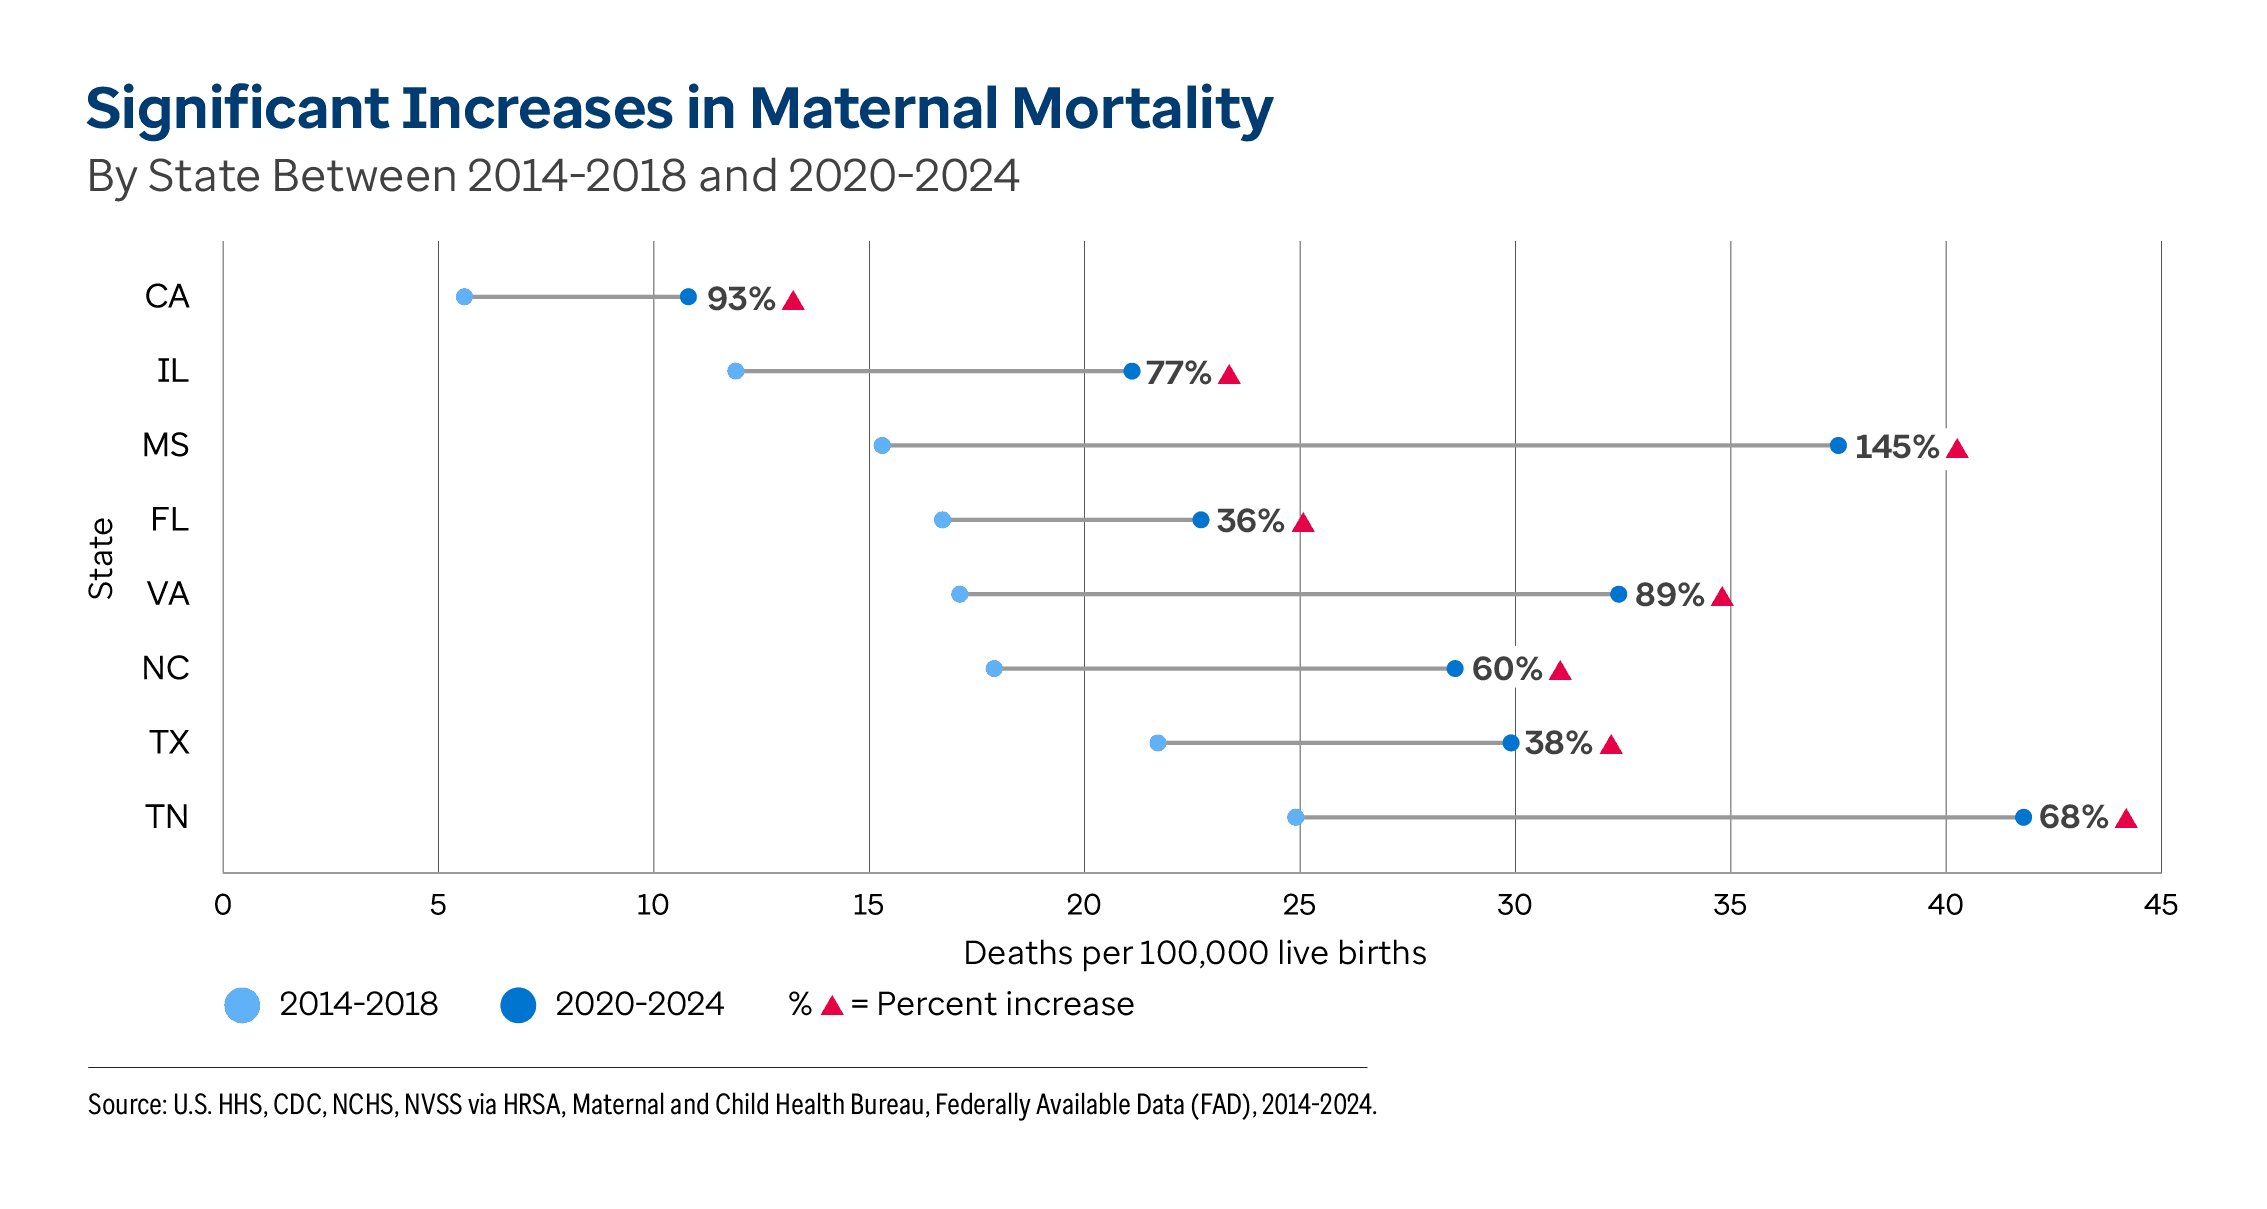
13 Changes over the last decade. Nationally, the
maternal mortality rate increased 34% between 2014-2018 and 2020-2024, from 17.3 to 23.1 deaths related to or aggravated by pregnancy (excluding accidental or incidental causes) occurring within 42 days of the end of a pregnancy per 100,000 live births. This rate exceeds the
Healthy People 2030 target of 15.7 maternal deaths per 100,000 live births.
14 Reducing maternal deaths is a Healthy People 2030
Leading Health Indicator.
5 In 2020-2024, approximately 4,200 women died of pregnancy-related causes, an increase of nearly 820 maternal deaths compared with 2014-2018.
In the decade between 2014-2018 and 2020-2024, the maternal mortality rate significantly increased in eight states. The largest increases were 145% in
Mississippi (15.3 to 37.5 deaths per 100,000 live births), 93% in
California (5.6 to 10.8) and 89% in
Virginia (17.1 to 32.4).
Recent differences. The maternal mortality rate varied significantly by race/ethnicity, geography, age, educational attainment and metropolitan status in 2020-2024. The rate was:
Note: Differences highlight the groups with the highest and lowest values. However, the values for certain race/ethnicity, age, educational attainment and metropolitan status groups may not differ significantly based on overlapping 95% confidence intervals. For more information, view
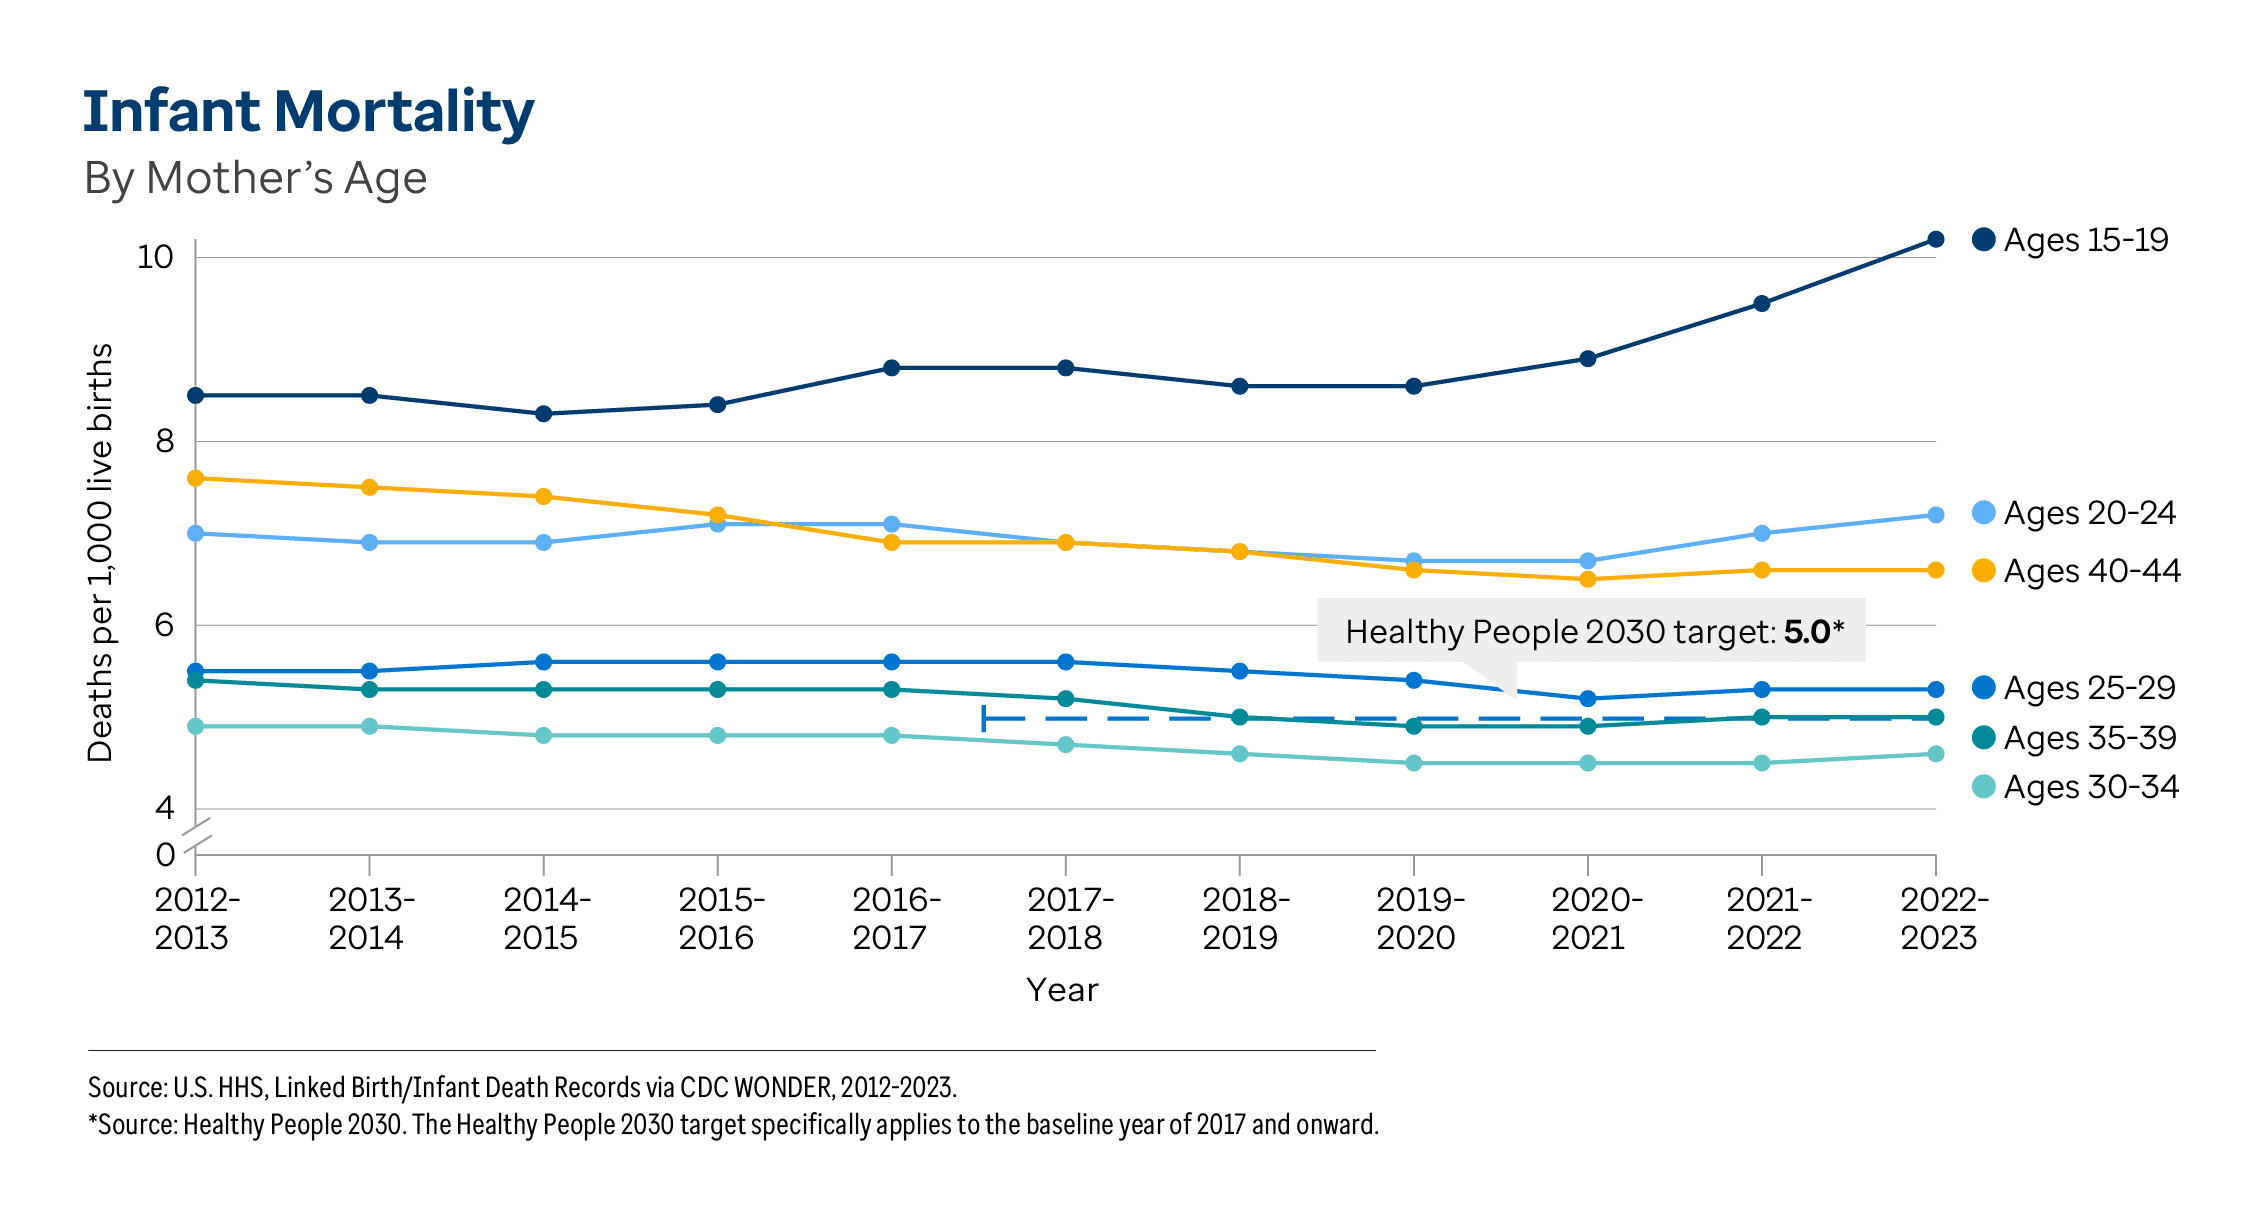
maternal mortality data.In the decade between 2012-2013 and 2022-2023, the infant mortality rate decreased 13% among infants born to mothers
ages 40-44 (7.6 to 6.6 deaths per 1,000 live births), 7% among infants born to mothers
ages 35-39 (5.4 to 5.0), 6% among infants born to mothers
ages 30-34 (4.9 to 4.6) and 4% among infants born to mothers
ages 25-29 (5.5 to 5.3). However, it also increased 20% among infants born to mothers
ages 15-19 (8.5 to 10.2) and 3% among infants born to mothers
ages 20-24 (7.0 to 7.2).
Between 2017-2018 and 2022-2023, the infant mortality rate significantly decreased:
- 6% among infants born to multiracial (6.9 to 6.5), 5% among infants born to Asian (3.7 to 3.5) and 4% among infants born to white (4.7 to 4.5) mothers.
- 3% among male (6.3 to 6.1) and 2% among female (5.2 to 5.1) infants.
Between 2017-2018 and 2022-2023, the infant mortality rate significantly increased 5% among infants born to
American Indian/Alaska Native mothers (8.7 to 9.1).
In the decade between 2012-2013 and 2022-2023, the infant mortality rate decreased 7% or more in 23 states and the District of Columbia, while increasing in five states. The largest decreases were 35% in
New Hampshire (4.9 to 3.2 deaths per 1,000 live births), 34% in
Rhode Island (6.5 to 4.3) and 26% in
North Dakota (6.2 to 4.6). The largest increases were 28% in
Alaska (5.4 to 6.9), 24% in
Nebraska (4.9 to 6.1) and 8% in
Iowa (4.8 to 5.2).
Recent differences. The infant mortality rate significantly varied by mother’s race/ethnicity, geography, mother’s age and infant gender. In 2022-2023, the rate was:
- 3.1 times higher among infants born to Black (10.9 deaths per 1,000 live births) compared with Asian (3.5) mothers.
- 2.8 times higher in Mississippi (9.0) than in New Hampshire (3.2).
- 2.2 times higher among infants born to mothers ages 15-19 (10.2) compared with those born to mothers ages 30-34 (4.6).
- 1.2 times higher among male (6.1) compared with female (5.1) infants.
Severe Maternal Morbidity
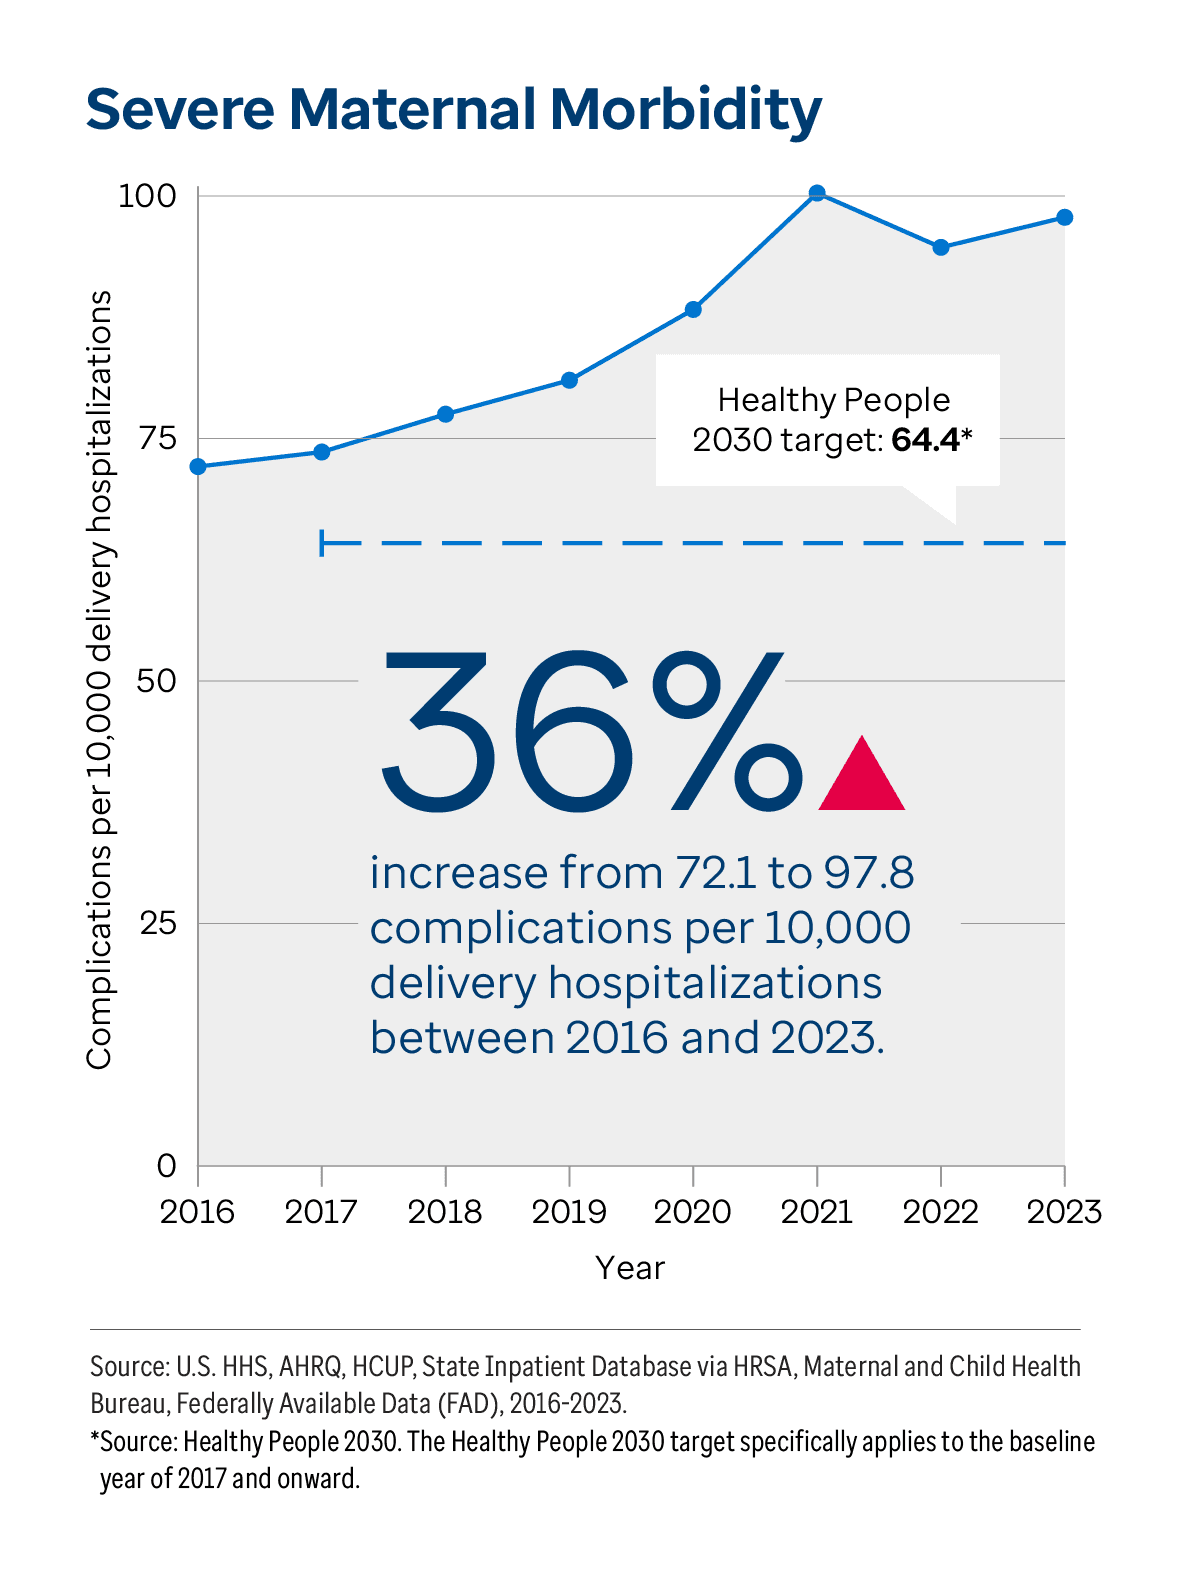
Between 2016 and 2023, severe maternal morbidity significantly increased in 29 states and the District of Columbia. The largest increases were 105% in both
Maine (52.9 to 108.6 complications per 10,000 delivery hospitalizations) and
Delaware (63.1 to 129.3), 99% in the
District of Columbia (88.4 to 176.1) and 97% in
Minnesota (61.6 to 121.2).
In the period between 2019 and 2023, severe maternal morbidity significantly increased:
Recent differences. The rate of severe maternal morbidity significantly varied by geography, race/ethnicity, age, metropolitan status and median ZIP code income. The prevalence was:
- 3.1 times higher in the District of Columbia (176.1 complications per 10,000 delivery hospitalizations) and 2.6 times higher in Alaska (147.2) than in Nebraska (56.8).
- 1.9 times higher among Black (155.5) compared with white (81.0) women.
- 1.9 times higher among women age 35 and older (142.5) compared with women ages 20-24 (77.0).
- 1.3 times higher among women living in large metropolitan areas (106.7) than women in nonmetropolitan areas (81.3).
- 1.1 times higher among women living in the least wealthy ZIP code quartile (107.7) compared with women in the second-wealthiest ZIP code quartile (93.7).
Note: Differences highlight the groups with the highest and lowest values. However, the values for certain income groups may not differ significantly based on overlapping 95% confidence intervals. For more information, view
severe maternal morbidity data.Changes over the last decade. Nationally, the prevalence of
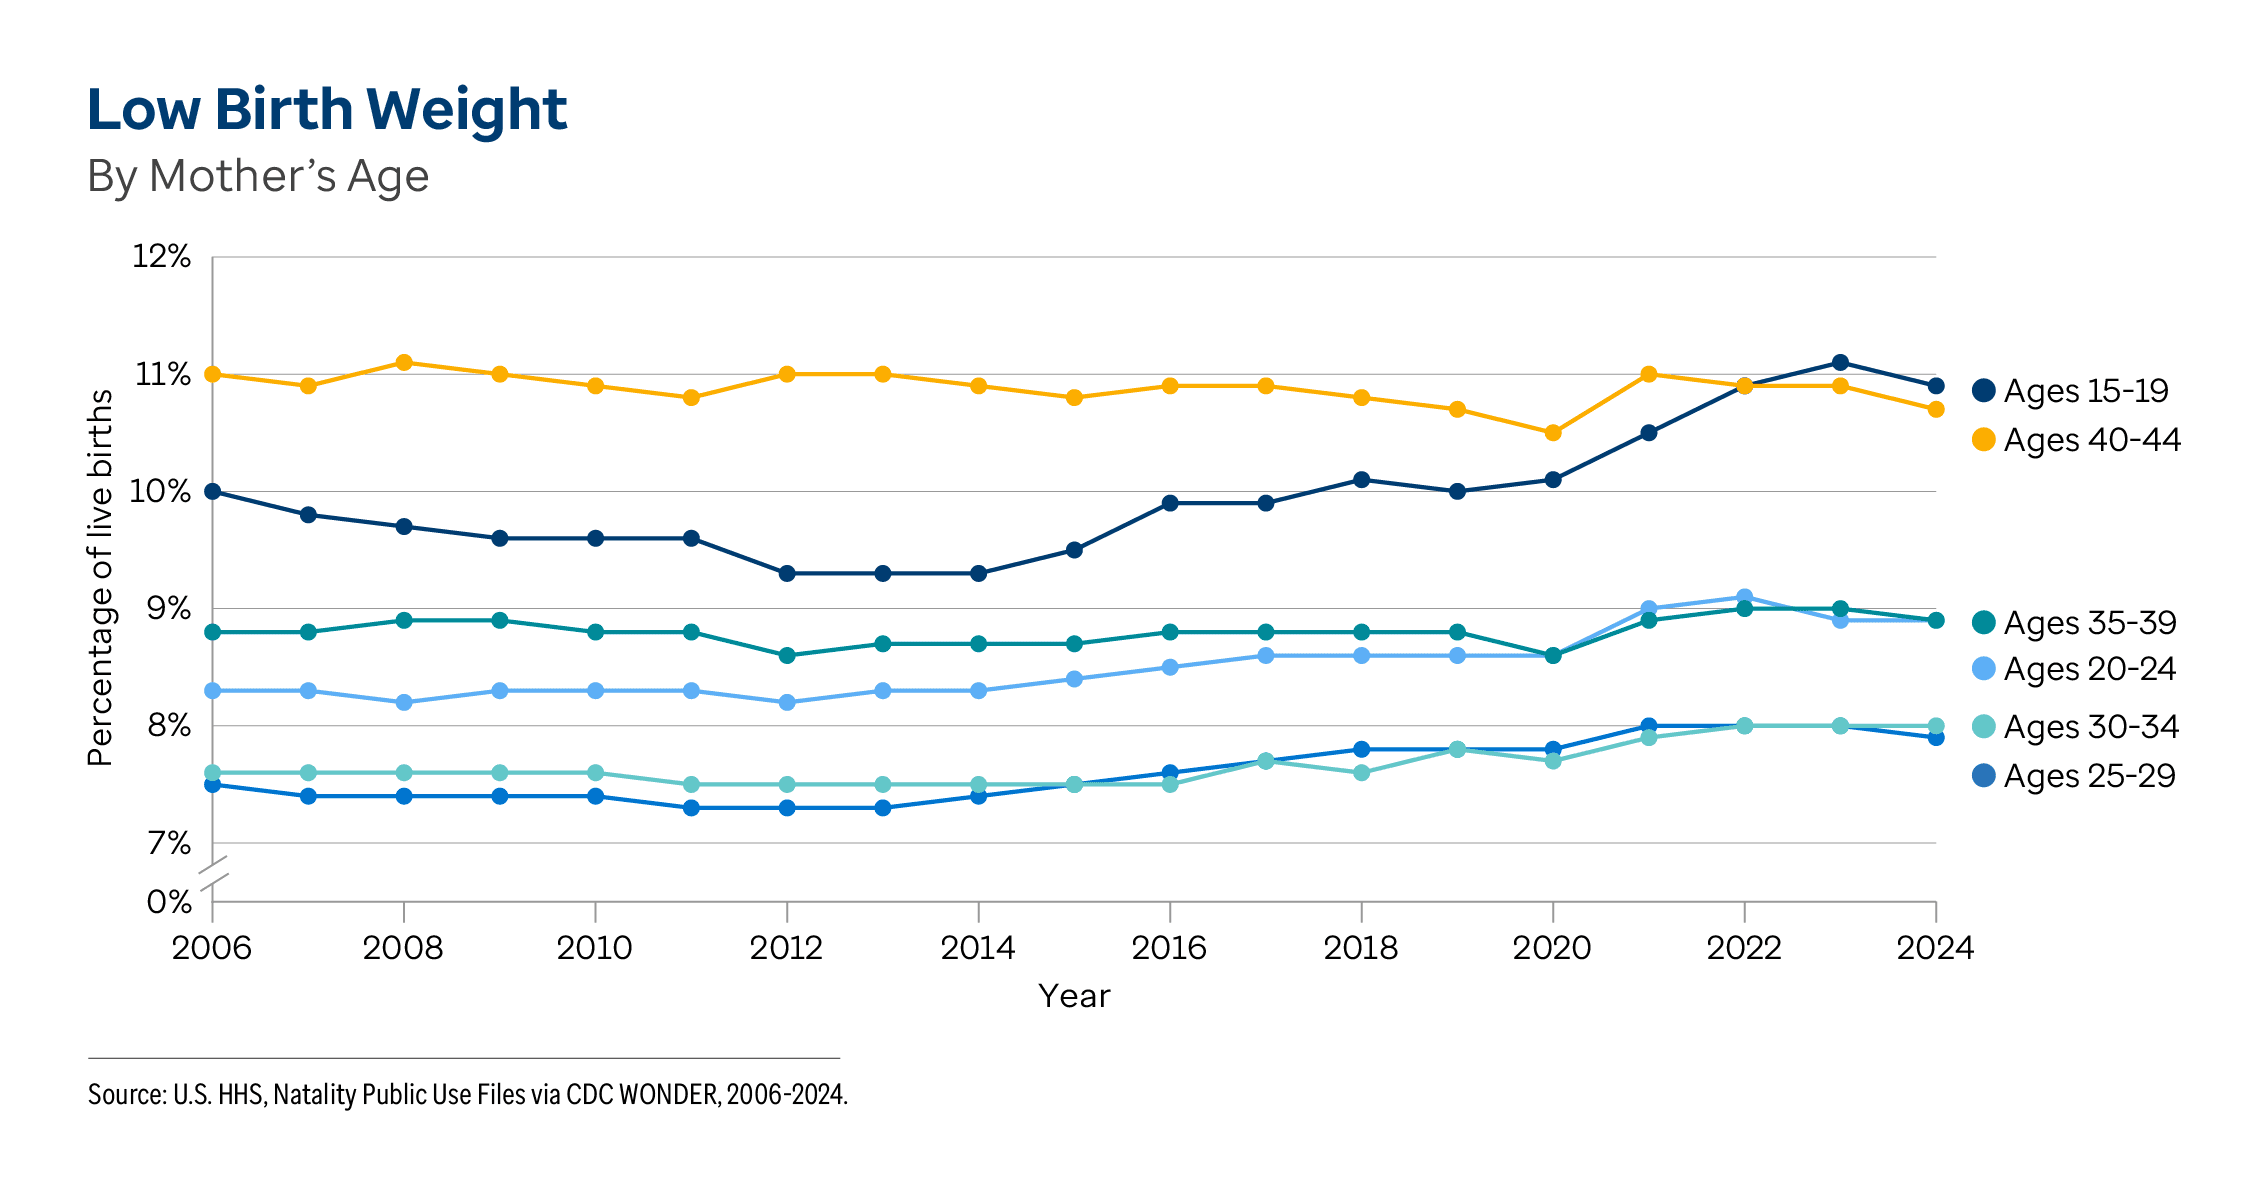
low birth weight — the percentage of infants weighing less than 2,500 grams (5 pounds, 8 ounces) at birth — increased 6% from 8.0% to 8.5% between 2014 and 2024. However, low birth weight decreased 1% in the most recent period between 2023 (8.6%) and 2024. In 2024, approximately 309,000 infants were born with low birth weight, nearly 10,000 fewer than in 2014.
In the decade between 2014 and 2024, low birth weight increased:
During the same time period, low birth weight increased 6% or more in 29 states and the District of Columbia. The largest increases were 21% in
Nebraska (6.6% to 8.0%), 17% in both
Nevada (8.3% to 9.7%) and
Alaska (5.9% to 6.9%), and 15% in both
Oregon (6.2% to 7.1%) and
North Dakota (6.2% to 7.1%).
Recent differences. Low birth weight significantly varied by race/ethnicity, geography, age and educational attainment. In 2024, it was:
- 2.1 times higher among infants born to Black (15.0%) compared with white (7.0%) mothers.
- 1.9 times higher in Mississippi (12.7%) than in New Hampshire (6.6%).
- 1.4 times higher among infants born to mothers ages 15-19 (10.9%) compared with mothers ages 25-29 (7.9%).
- 1.4 times higher among infants born to mothers with less than a high school education (10.0%) compared with mothers who graduated from college (7.1%).
Note: Differences highlight the groups with the highest and lowest values. However, the values for certain age and educational attainment groups may not differ significantly based on overlapping 95% confidence intervals. For more information, view
low birth weight data.
Low Birth Weight Racial Disparity
Nationally, the
racial disparity in low birth weight — the ratio of the low birth weight rate of the racial/ethnic group with the highest rate to the non-Hispanic white rate — increased 5% from 2.0 (14.1% of Black infants versus 6.9% of white infants) to 2.1 (14.9% of Black infants versus 7.0% of white infants) between 2018-2020 and 2022-2024.
Nationally,
breastfeeding prevalence — the percentage of infants exclusively breastfed for six months — increased 27% from 21.9% to 27.9% between the 2012 and 2022 birth cohorts, remaining lower than the
Healthy People 2030 target of 42.4% of infants.
23 During the same period, breastfeeding significantly increased in seven states. The largest increases were 140% in
Mississippi (10.0% to 24.0%), 136% in
Alabama (11.2% to 26.4%) and 132% in
Louisiana (11.8% to 27.4%). In the 2022 birth cohort, the percentage of infants exclusively breastfed for six months was 1.9 times higher in
Nebraska (36.7%) than in
Georgia (19.5%).
Cigarette Smoking During Pregnancy
Nationally,
cigarette smoking during pregnancy decreased 71% from 8.4% to 2.4% of live births between 2014 and 2024. In 2024, almost 87,000 mothers reported smoking cigarettes during pregnancy — 228,000 fewer mothers than in 2014.
During the same time period, the percentage of mothers who reported smoking cigarettes during pregnancy decreased 71% or more in 17 states and the District of Columbia. The largest decreases were 80% in
Idaho (10.7% of live births to 2.1%) and 79% in both
Massachusetts (6.2% to 1.3%) and
Texas (3.9% to 0.8%). In 2024, the prevalence was 26.2 times higher in
West Virginia (10.5%) than in
California (0.4%) and 3.1 times higher among mothers in
nonmetropolitan areas (5.8%) compared with mothers in
metropolitan areas (1.9%).
Neonatal Abstinence Syndrome
Changes over time. Nationally, the rate of
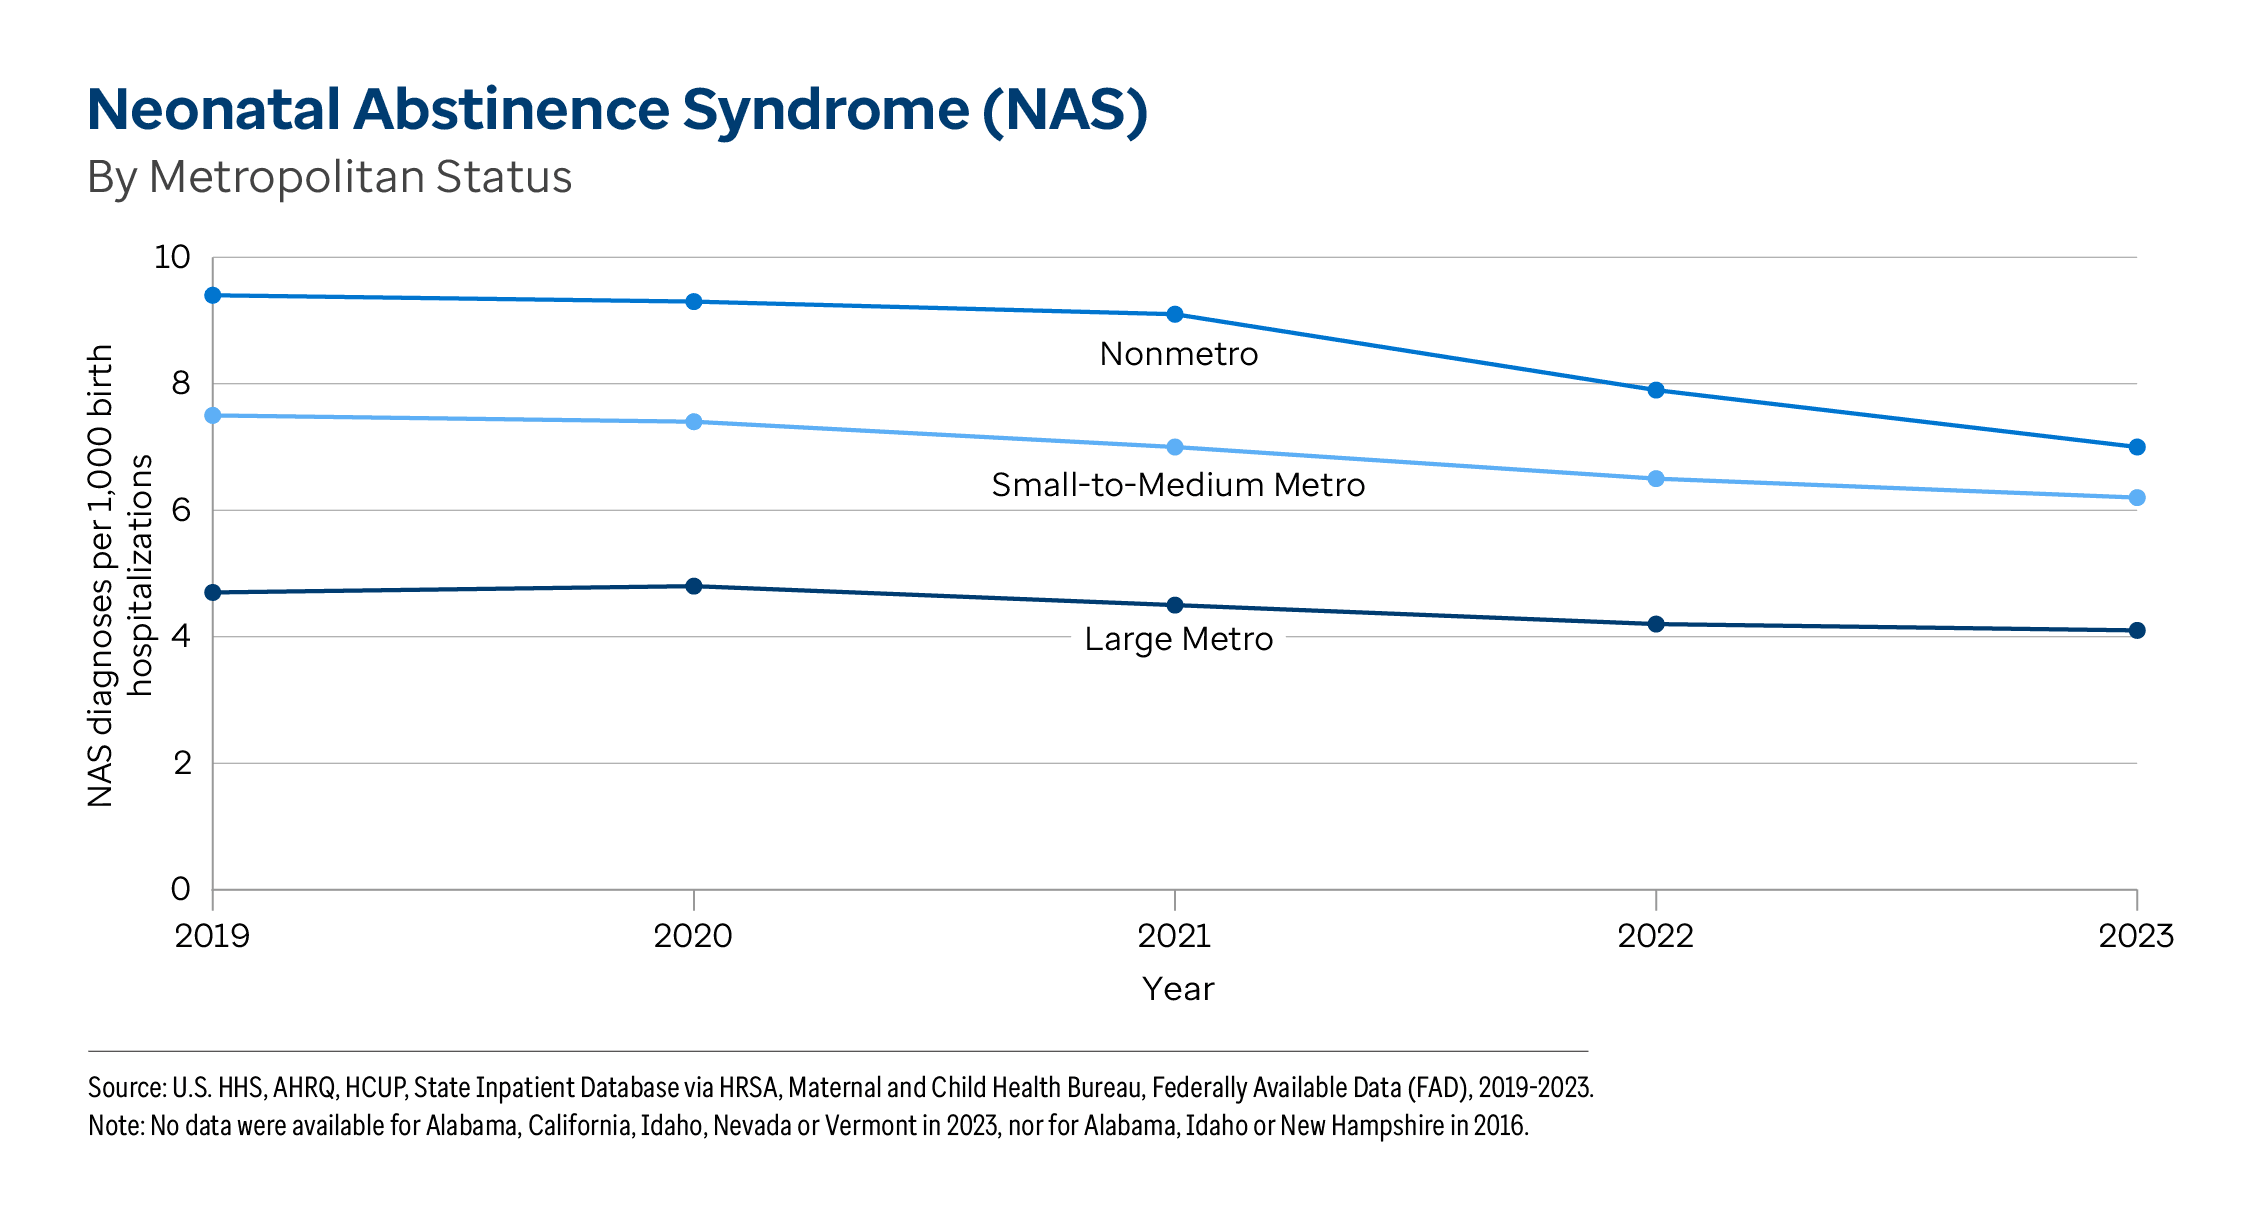
NAS decreased 25% between 2016 and 2023, from 6.8 to 5.1 birth hospitalizations with a diagnosis code of withdrawal symptoms due to prenatal exposure to illicit drugs per 1,000 birth hospitalizations. In 2023, there were approximately 14,800 NAS diagnoses in the U.S., about 10,000 fewer diagnoses than in 2016.
Between 2016 and 2023, the NAS hospitalization rate significantly decreased in 19 states. The largest decreases were 67% in
Delaware (26.8 to 8.9 NAS diagnoses per 1,000 birth hospitalizations), 65% in
Massachusetts (14.2 to 4.9) and 58% in
Tennessee (18.0 to 7.6). During the same time period, the NAS hospitalization rate significantly increased in three states: 42% in
Arizona (7.2 to 10.2), 30% in
Oregon (6.3 to 8.2) and 29% in
South Carolina (4.2 to 5.4).
Recent differences. The NAS hospitalization rate significantly varied by geography, race/ethnicity, median ZIP code income and metropolitan status in 2023. The rate was:
Note: No data were available for Alabama, California, Idaho, Nevada or Vermont in 2023, nor for Alabama, Idaho or New Hampshire in 2016.
Changes over the last decade. Nationally, the prevalence of
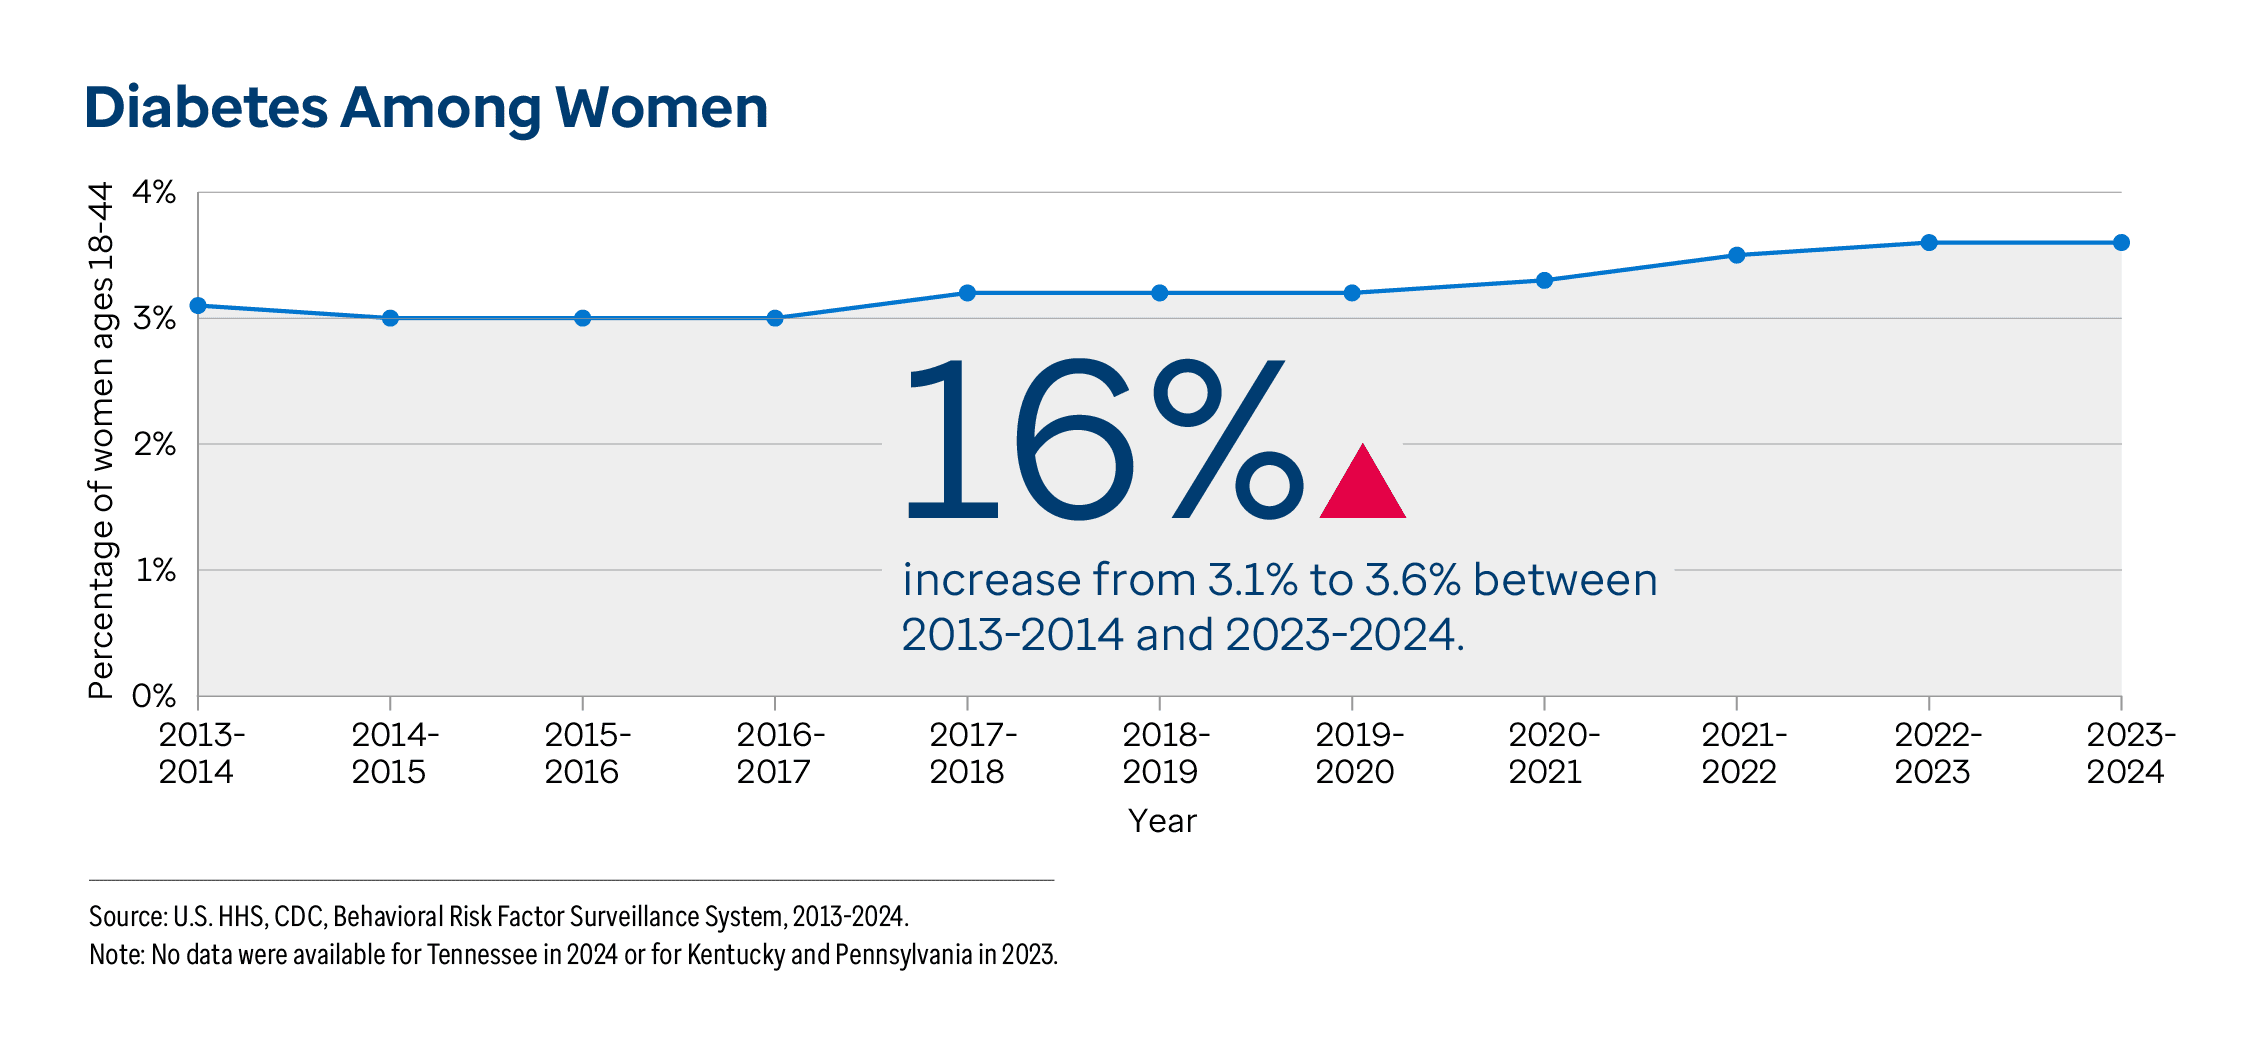
diabetes — the percentage of women ages 18-44 who reported being told by a health professional that they had diabetes — increased 16% from 3.1% to 3.6% between 2013-2014 and 2023-2024. In 2023-2024, nearly 2.1 million women ages 18-44 reported having diabetes, an increase of 336,100 women compared with 2013-2014.
In the decade between 2013-2014 and 2023-2024, the prevalence of diabetes among women ages 18-44 significantly increased:
Recent differences. The prevalence of diabetes significantly varied by disability status, income, geography, age, educational attainment, race/ethnicity and metropolitan status. In 2023-2024, the prevalence among women ages 18-44 was:
Note: No data were available for Tennessee in 2024 or for Kentucky and Pennsylvania in 2023. Differences highlight the groups with the highest and lowest values. However, the values for certain disability, income, educational attainment and race/ethnicity groups may not differ significantly based on overlapping 95% confidence intervals. For more information, view
diabetes data for women.High Health Status Among Women
Self-reported health status measures how individuals
perceive their health.
29 Those with “poor” self-reported health status have a higher
mortality risk than those with “excellent” self-reported health status.
30 Changes over the last decade. Nationally,
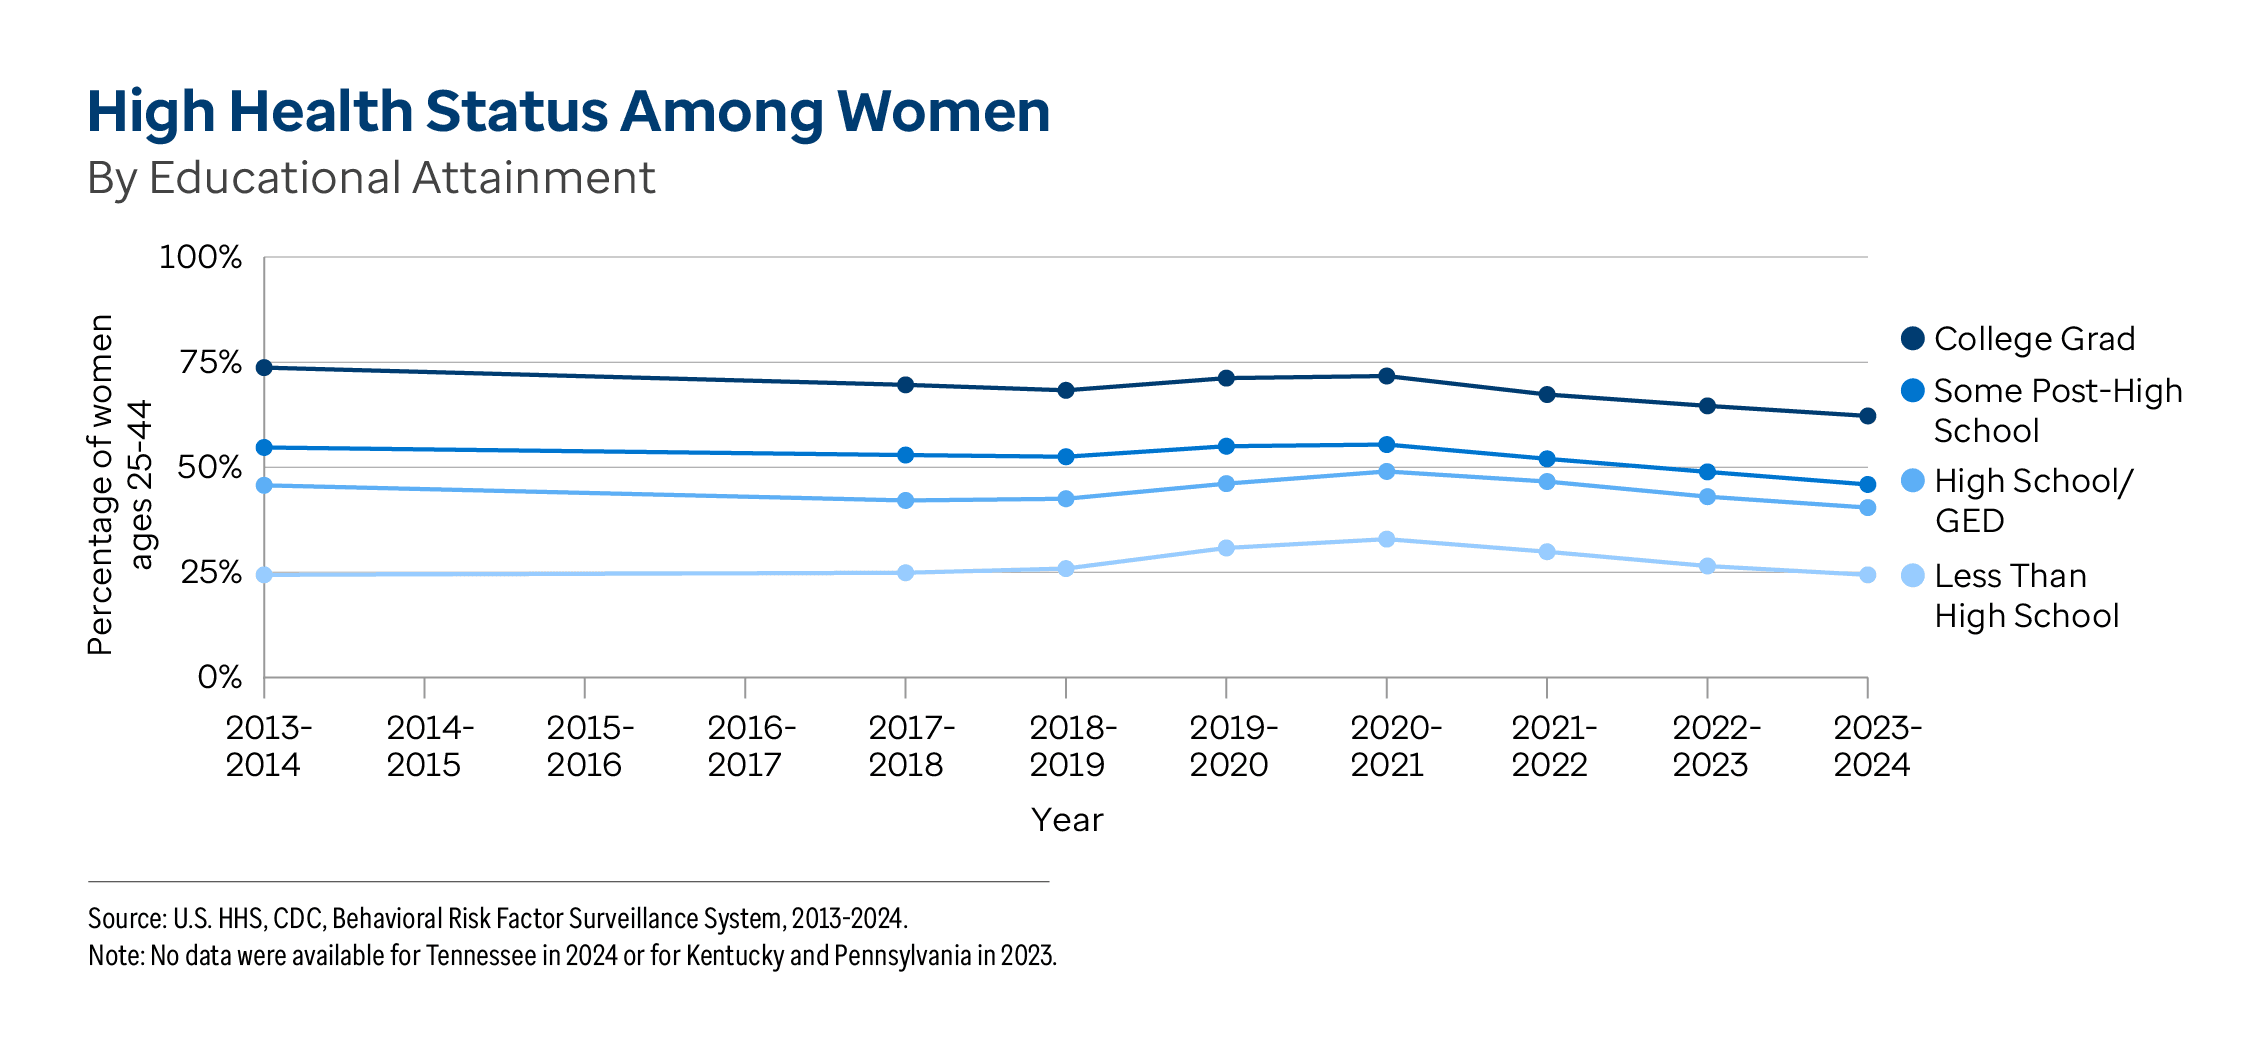
high health status — the percentage of women ages 18-44 who reported their health is very good or excellent — decreased 12% from 56.0% to 49.4% between 2013-2014 and 2023-2024. Notably, 10% of this decline occurred recently, between 2021-2022 and 2023-2024. In 2023-2024, 28.7 million women reported having high health status, 2.9 million fewer women than in 2013-2014.
Between 2013-2014 and 2023-2024, high health status among women ages 18-44 significantly decreased:
During the same time, high health status significantly decreased in 35 states. The largest decreases were 23% in
Iowa (62.7% to 48.3%), 22% in
Oregon (59.6% to 46.5%) and 20% in
Pennsylvania (59.8% to 48.1%).
Recent differences. In 2023-2024, high health status among women ages 18-44 was:
Note: No data were available for Tennessee in 2024 or for Kentucky and Pennsylvania in 2023. Differences highlight the groups with the highest and lowest values. However, the values for certain disability, race/ethnicity and age groups may not differ significantly based on overlapping 95% confidence intervals. For more information, view
high health status data for women.
Changes over the last decade. Nationally,
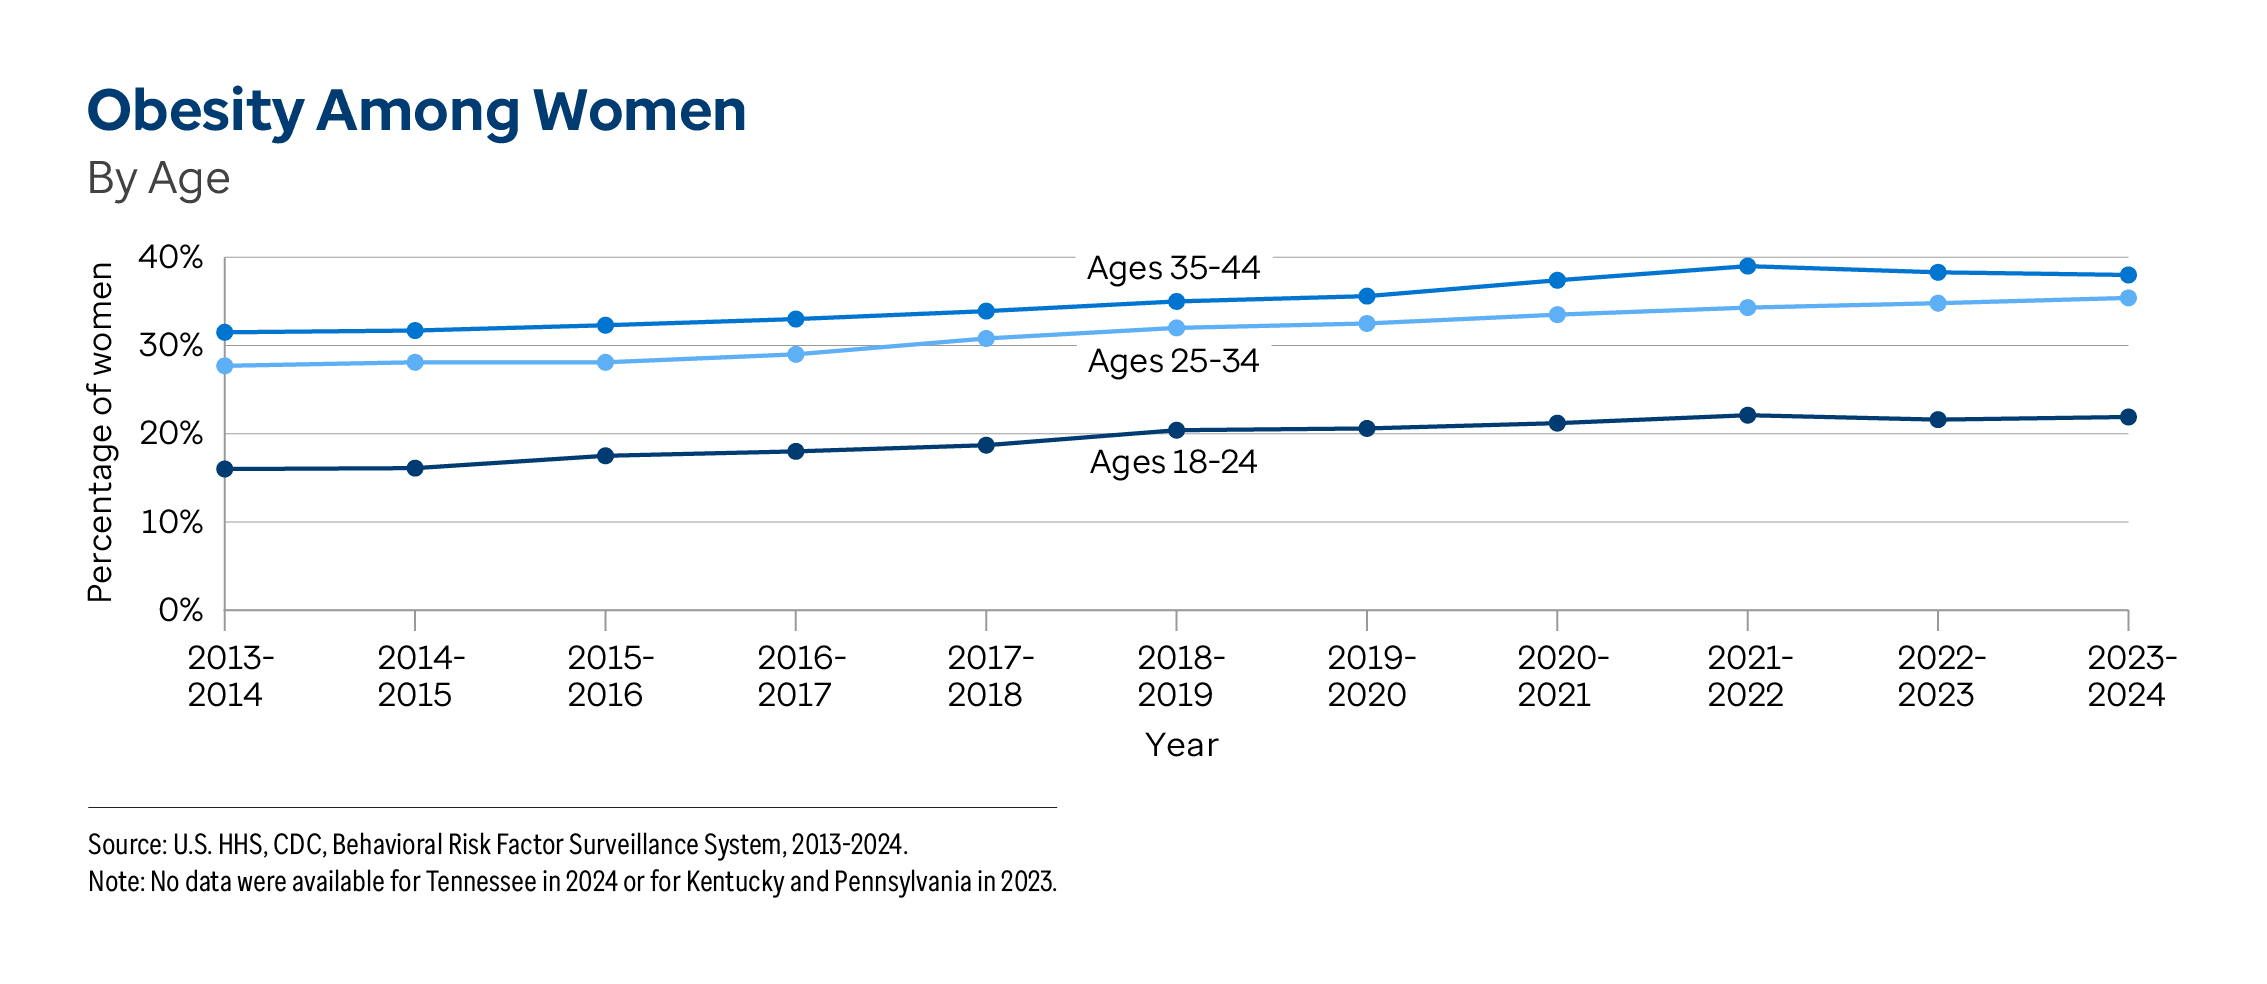
obesity — the percentage of women ages 18-44 who have a body mass index (BMI) of 30.0 or higher based on reported height and weight — increased 26% from 25.9% to 32.6% between 2013-2014 and 2023-2024. In 2023-2024, 16 million women ages 18-44 had obesity, nearly 3.2 million more women than in 2013-2014.
Between 2013-2014 and 2023-2024, obesity among women ages 18-44 significantly increased:
- 53% among women with an annual household income of $50,000 to $74,999 (26.5% to 40.6%), 30% among women with an income of $25,000 to $49,999 (33.8% to 44.1%) and 13% among women with an income less than $25,000 (39.5% to 44.8%).
- 51% among Asian (8.0% to 12.1%), 35% among white (23.3% to 31.5%), 20% among Hispanic (29.1% to 34.8%) and 14% among Black (39.5% to 45.2%) women.
- 50% among college graduates (18.2% to 27.3%), 26% among women with some post-high school education (33.4% to 42.0%), 20% among high school graduates (36.2% to 43.4%) and 12% among women with less than a high school education (39.8% to 44.6%).
- 37% among women ages 18-24 (16.0% to 21.9%), 28% among women ages 25-34 (27.7% to 35.4%) and 21% among women ages 35-44 (31.5% to 38.0%).
During the same time period, the prevalence of obesity significantly increased in 40 states. The largest increases were 45% in
Minnesota (21.7% to 31.4%), 40% in
Nebraska (25.8% to 36.1%), and 39% in both
South Dakota (25.5% to 35.4%) and
Alabama (31.0% to 43.1%).
Recent differences. In 2023-2024, obesity among women ages 18-44 was:
- 3.7 times higher among Black (45.2%) than Asian (12.1%) women.
- 2.1 times higher among both women with an annual household income less than $25,000 (44.8%) and women with an income of $25,000 to $49,999 (44.1%) than women with an income of $150,000 or more (21.2%).
- 1.8 times higher in West Virginia (43.4%) than in the District of Columbia and Massachusetts (both 24.3%); and among women who have difficulty with mobility (53.3%) than women without a disability (30.3%).
- 1.7 times higher among women ages 35-44 (38.0%) than women ages 18-24 (21.9%).
- 1.6 times higher among both women with less than a high school education (44.6%) and high school graduates (43.4%) than college graduates (27.3%).
- 1.3 times higher among women living in nonmetropolitan areas (39.8%) than women in metropolitan areas (31.5%).
- 1.1 times higher among LGBQ+ (36.9%) than straight women (33.7%).
Note: No data were available for Tennessee in 2024 or for Kentucky and Pennsylvania in 2023. Differences highlight the groups with the highest and lowest values. However, the values for certain race/ethnicity, income, disability status and educational attainment groups may not differ significantly based on overlapping 95% confidence intervals. For more information, view
obesity data for women.Physical Inactivity Among Women
Nationally, the prevalence of
physical inactivity — the percentage of women ages 18-44 who reported doing no physical activity or exercise other than their regular job in the past 30 days — remained unchanged over the last 10 years (22.5% in 2013-2014 to 22.0% in 2023-2024). In 2023-2024, 12.8 million women ages 18-44 reported being physically inactive.
In the decade between 2013-2014 and 2023-2024, the prevalence of physical inactivity among women ages 18-44 significantly decreased 34% in the
District of Columbia (19.4% to 12.9%), 17% in
Utah (16.9% to 14.0%) and 16% in
Indiana (25.0% to 21.0%). In 2023-2024, the prevalence among women ages 18-44 was 2.4 times and 2.2 times higher in
Mississippi (30.8%) than in the District of Columbia (12.9%) and Utah (14.0%). The prevalence of physical inactivity also significantly varied by income, education, disability status, race/ethnicity, veteran status, age and sexual orientation. For more information, view
physical inactivity data for women.
Physical Activity Among Children
Nationally, the prevalence of
physical activity — the percentage of children ages 6-17 who were physically active at least 60 minutes every day in the past week — decreased 14% from 23.0% to 19.7% between 2016-2017 and 2023-2024. In 2023-2024, 9.7 million children engaged in sufficient physical activity, a decrease of nearly 1.5 million children compared with 2016-2017.
Between 2016-2017 and 2023-2024, the prevalence of physical activity among children ages 6-17 significantly decreased 49% in
Nevada (25.3% to 12.9%), 31% in
California (25.5% to 17.6%) and 30% in
Oklahoma (28.9% to 20.1%). In 2023-2024, the prevalence was 2.1 times higher in
Maine (26.6%) than in Nevada (12.9%). The prevalence of physical activity also significantly varied by race/ethnicity, gender, caregiver educational attainment and special health care needs status. For more information, view
physical activity data for children.
Overweight or Obesity Among Children
Nationally, the prevalence of
overweight or obesity — the percentage of children ages 6-17 who have overweight or obesity for their age based on reported height and weight — remained unchanged between 2016-2017 (32.3%) and 2023-2024 (31.3%). In 2023-2024, 14.7 million children were overweight or obese.
In 2023-2024, the prevalence of overweight or obesity among children ages 6-17 was 1.8 times higher in
Mississippi (41.8%) than in
Colorado (23.1%). The prevalence of overweight or obesity also significantly varied by race/ethnicity, caregiver’s educational attainment, special health care needs status and gender. For more information, view
overweight or obesity data for children.

 US Summary
 Alabama
 Alaska
 Arizona
 Arkansas
 California
 Colorado
 Connecticut
 Delaware
 District of Columbia
 Florida
 Georgia
 Hawaii
 Idaho
Idaho Illinois
 Indiana
 Iowa
Iowa Kansas
 Kentucky
 Louisiana
 Maine
Maine Maryland
 Massachusetts
 Michigan
 Minnesota
 Mississippi
 Missouri
 Montana
 Nebraska
 Nevada
 New Hampshire
 New Jersey
 New Mexico
 New York
 North Carolina
 North Dakota
 Ohio
Ohio Oklahoma
 Oregon
 Pennsylvania
 Rhode Island
 South Carolina
 South Dakota
 Tennessee
 Texas
Texas Utah
Utah Vermont
 Virginia
 Washington
 West Virginia
 Wisconsin
 Wyoming