Over the course of my career as a maternal fetal medicine specialist, I have seen how sustained attention can gradually improve the health of women and infants. I am encouraged that more women are receiving preventive care and breastfeeding, while fewer women use tobacco products during pregnancy and fewer babies are born with neonatal abstinence syndrome. The progress documented in this report reflects decades of work by health care providers, public health leaders, community organizations and individuals. Yet, these achievements over the past decade stand in contrast to the fact that maternal morbidity and mortality increased dramatically over the same time period. Ten years of data give us a clearer picture of where improvements are taking hold, where gaps persist and where action is needed. By continuing to follow the evidence, listen to communities and build on the work underway, we can help more women and children live healthier lives.
– Lisa Saul, MD, MBA
Chief Medical Officer, Women’s Health, UnitedHealth Group
A decade of progress in behaviors, care and socioeconomic conditions did not consistently translate into better health outcomes for women and children
Between 2014 and 2024, the number of women ages 18-44 in the United States grew 6%, from 57.2 million to 60.9 million, while the number of children younger than 18 decreased 1%, from 73.6 million to 73.1 million. Today, women of reproductive age and children make up close to 40% of the U.S. population — nearly 134 million people — underscoring the importance of their health to the well-being of communities nationwide.
This edition marks the 10th anniversary of the America’s Health Rankings® Health of Women and Children Report, providing a decade of insights into the health and well-being of women and children across the United States.
This long-term view shows meaningful progress in infant health outcomes as well as several drivers of women’s and children’s health, including behaviors, clinical care and socioeconomic conditions. Many of these improvements reflect sustained public health and clinical efforts — and illustrate the time it can take for progress to be seen at the population level.
At the same time, improvements in these areas have not consistently coincided with better health outcomes. Maternal morbidity and mortality rose, chronic conditions worsened among women, and mental health challenges increased among both women and children. Injury deaths also increased, while declines in physical activity and access to care among children point to additional opportunities for improvement.
A decade of data shows places where long-term progress has stalled or reversed. For example, food insecurity and housing cost burden have increased in recent years, counteracting the impact of sustained improvements earlier in the decade. These findings highlight how sustained focus over time is needed to improve health outcomes for women and children across their lifespan.
Please view the full
2026 Health of Women and Children Report for more information on
sources and
methodology.
State Summaries provide tailored data and insights about the demographics and health of women and children in specific states to guide local action. Visit State Summaries to explore the data.
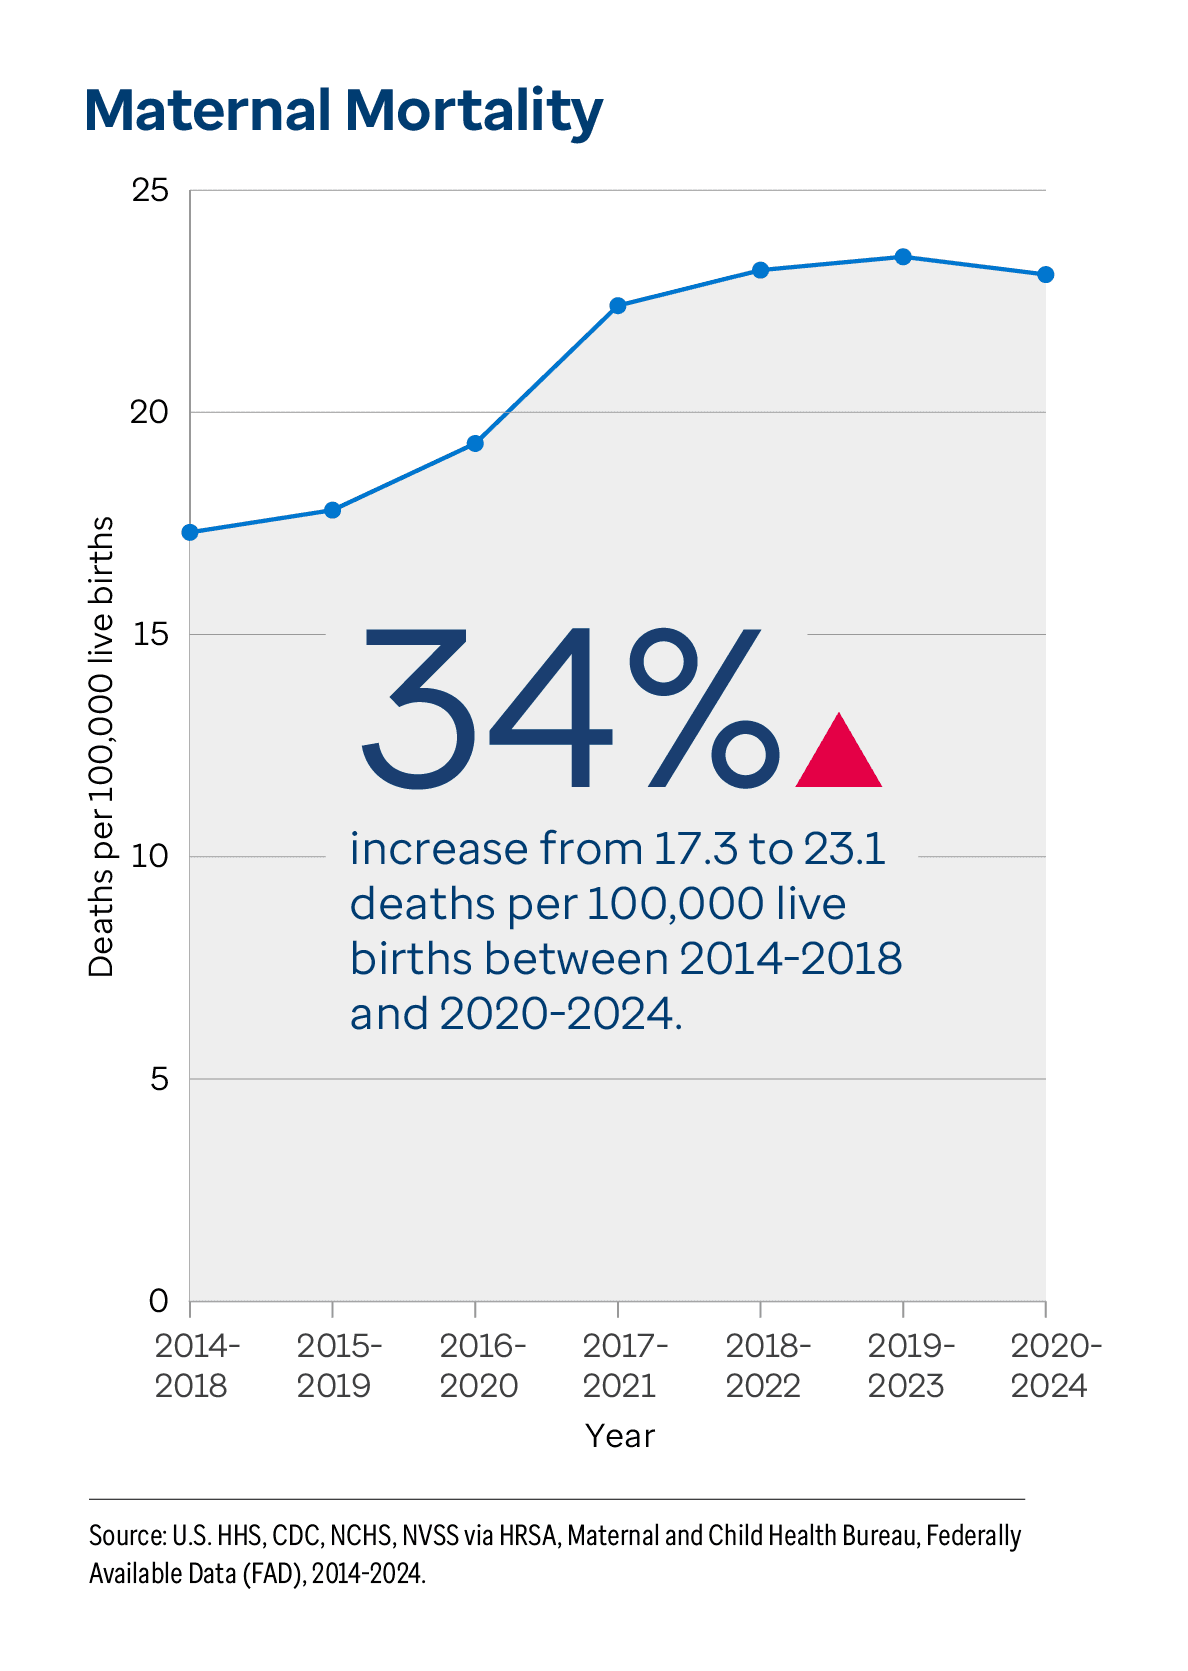
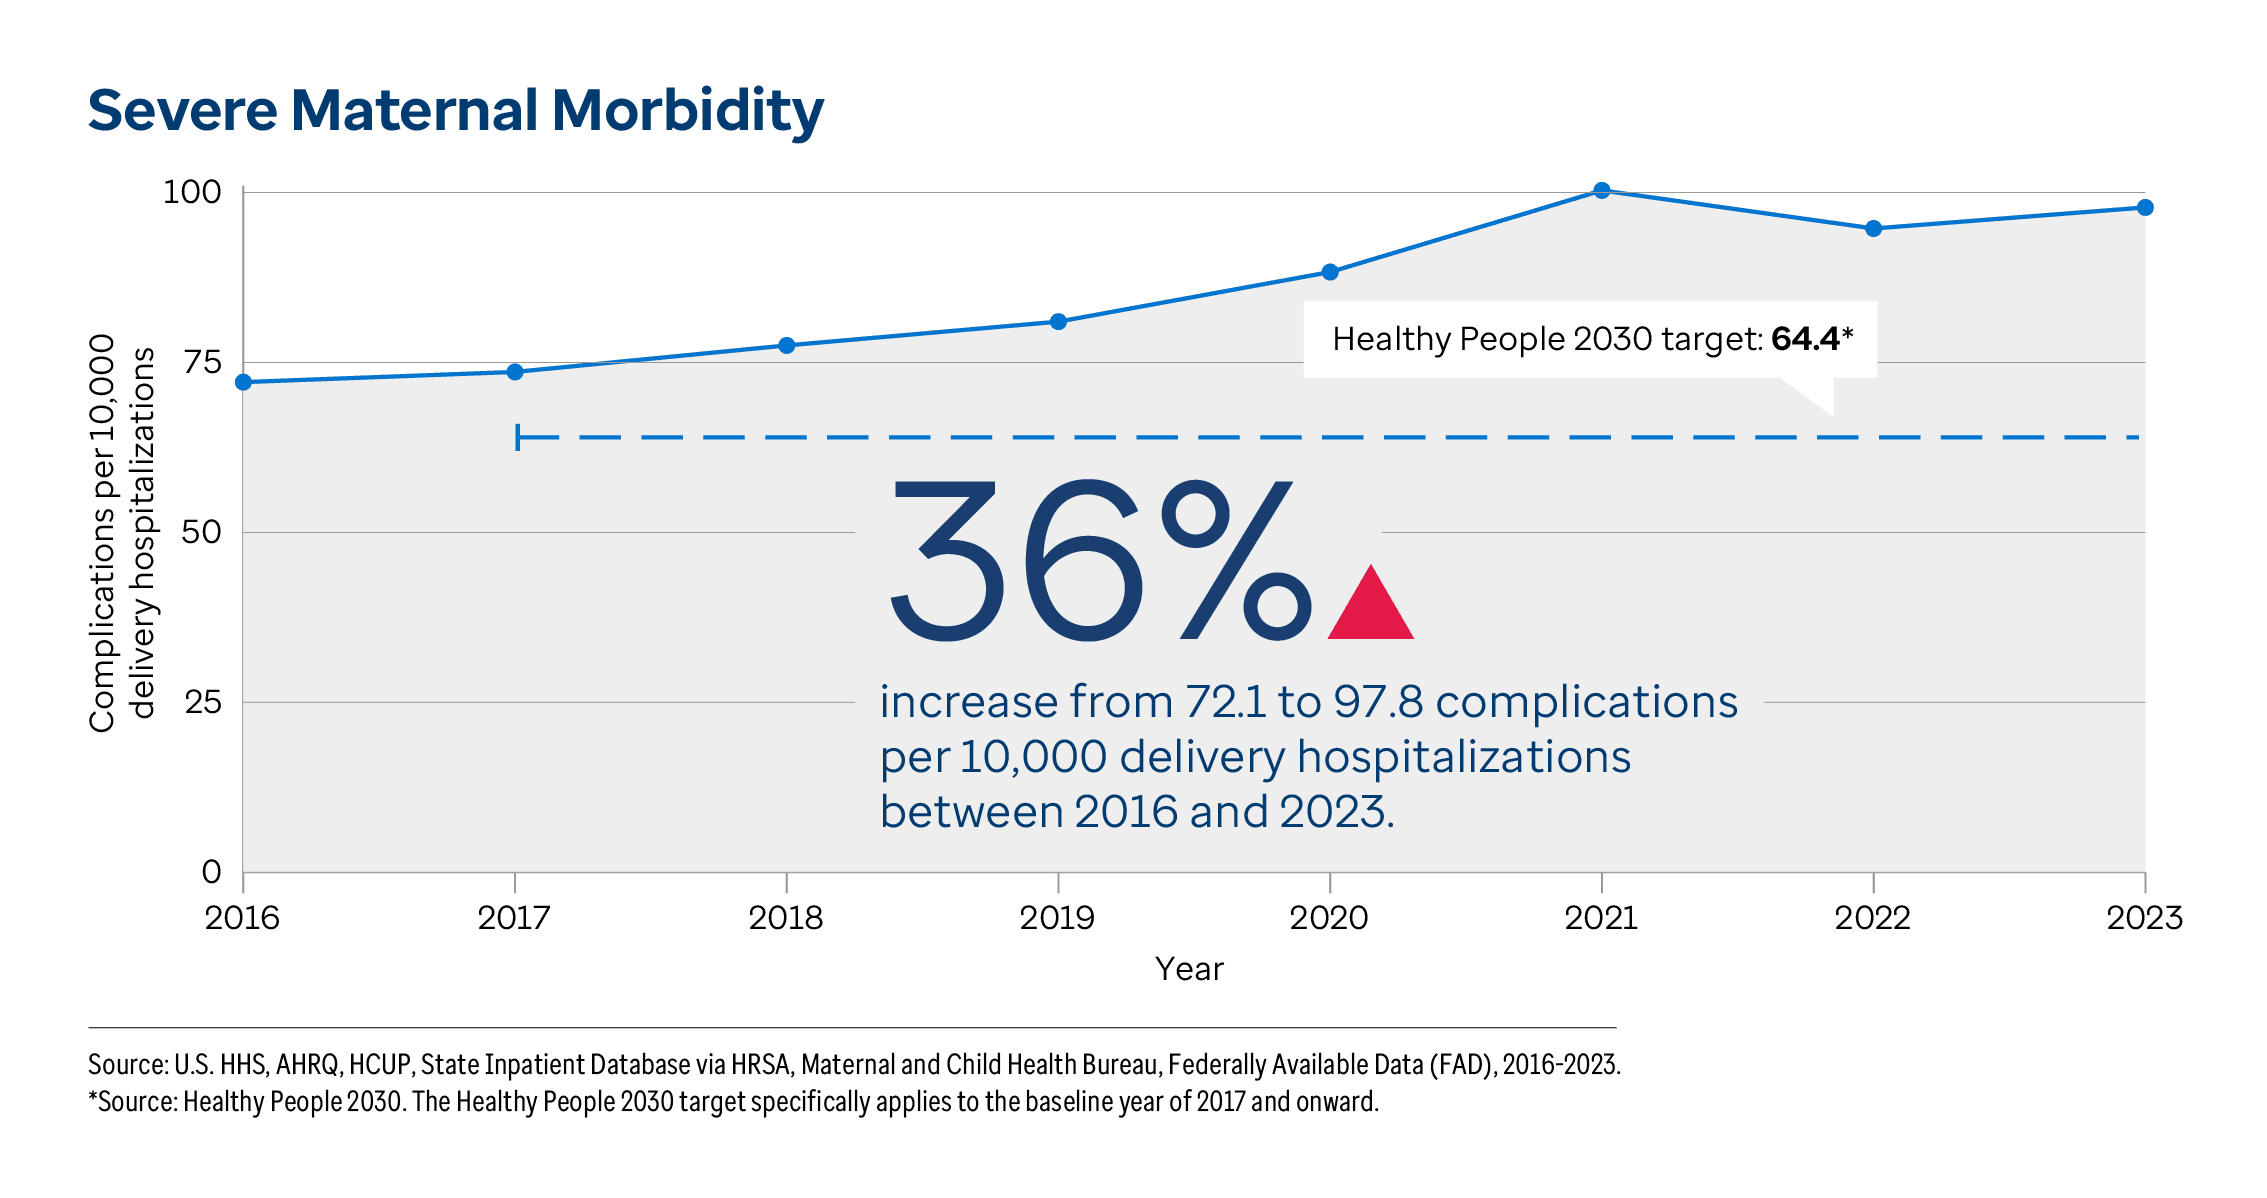
Maternal health outcomes worsened over the past decade despite improvements in maternal health behaviors and infant well-being Over the long term, challenges grew across multiple measures of maternal health outcomes. Severe maternal morbidity, which describes serious and potentially life-threatening events and outcomes resulting from labor and delivery, increased 36% from 72.1 to 97.8 complications per 10,000 delivery hospitalizations between 2016 and 2023. Maternal mortality increased 34% from 17.3 to 23.1 deaths per 100,000 live births between 2014-2018 and 2020-2024. Leading causes of pregnancy-related death include
cardiovascular conditions, other noncardiovascular medical conditions (endocrine, hematologic, immunologic and renal), and infection or sepsis. Maternal Mortality Review Committees have also identified
mental health conditions as a leading cause of pregnancy-related deaths.
Maternal mortality rates vary among different groups. Rates were higher among American Indian/Alaska Native (58.9 deaths per 100,000 live births) and Black (54.2) women than Asian (14.3) and multiracial (14.3) women in 2020-2024. Differences can also be seen by geography: The maternal mortality rate was 3.9 times higher in Tennessee (41.8) than in California (10.8) in 2020-2024.
The prevalence of low birth weight also worsened over the decade. The percentage of infants weighing less than 5 pounds, 8 ounces at birth increased 6% from 8.0% to 8.5% between 2014 and 2024. There was some improvement in the most recent period, as low birth weight improved 1%, decreasing from 8.6% in 2023 to 8.5% in 2024. Racial health disparities persisted. The disparity ratio between rates of low birth weight among Black infants — the group with the highest rate — and non-Hispanic white infants widened 5% (2.0 to 2.1) between 2018-2020 and 2022-2024. Differences in low birth weight were also seen by maternal age: The prevalence increased most among infants born to mothers ages 15-19, rising 17% from 9.3% in 2014 to 10.9% in 2024. Low birth weight infants are at increased risk of several
short- and long-term complications — and low birth weight and preterm birth are leading causes of
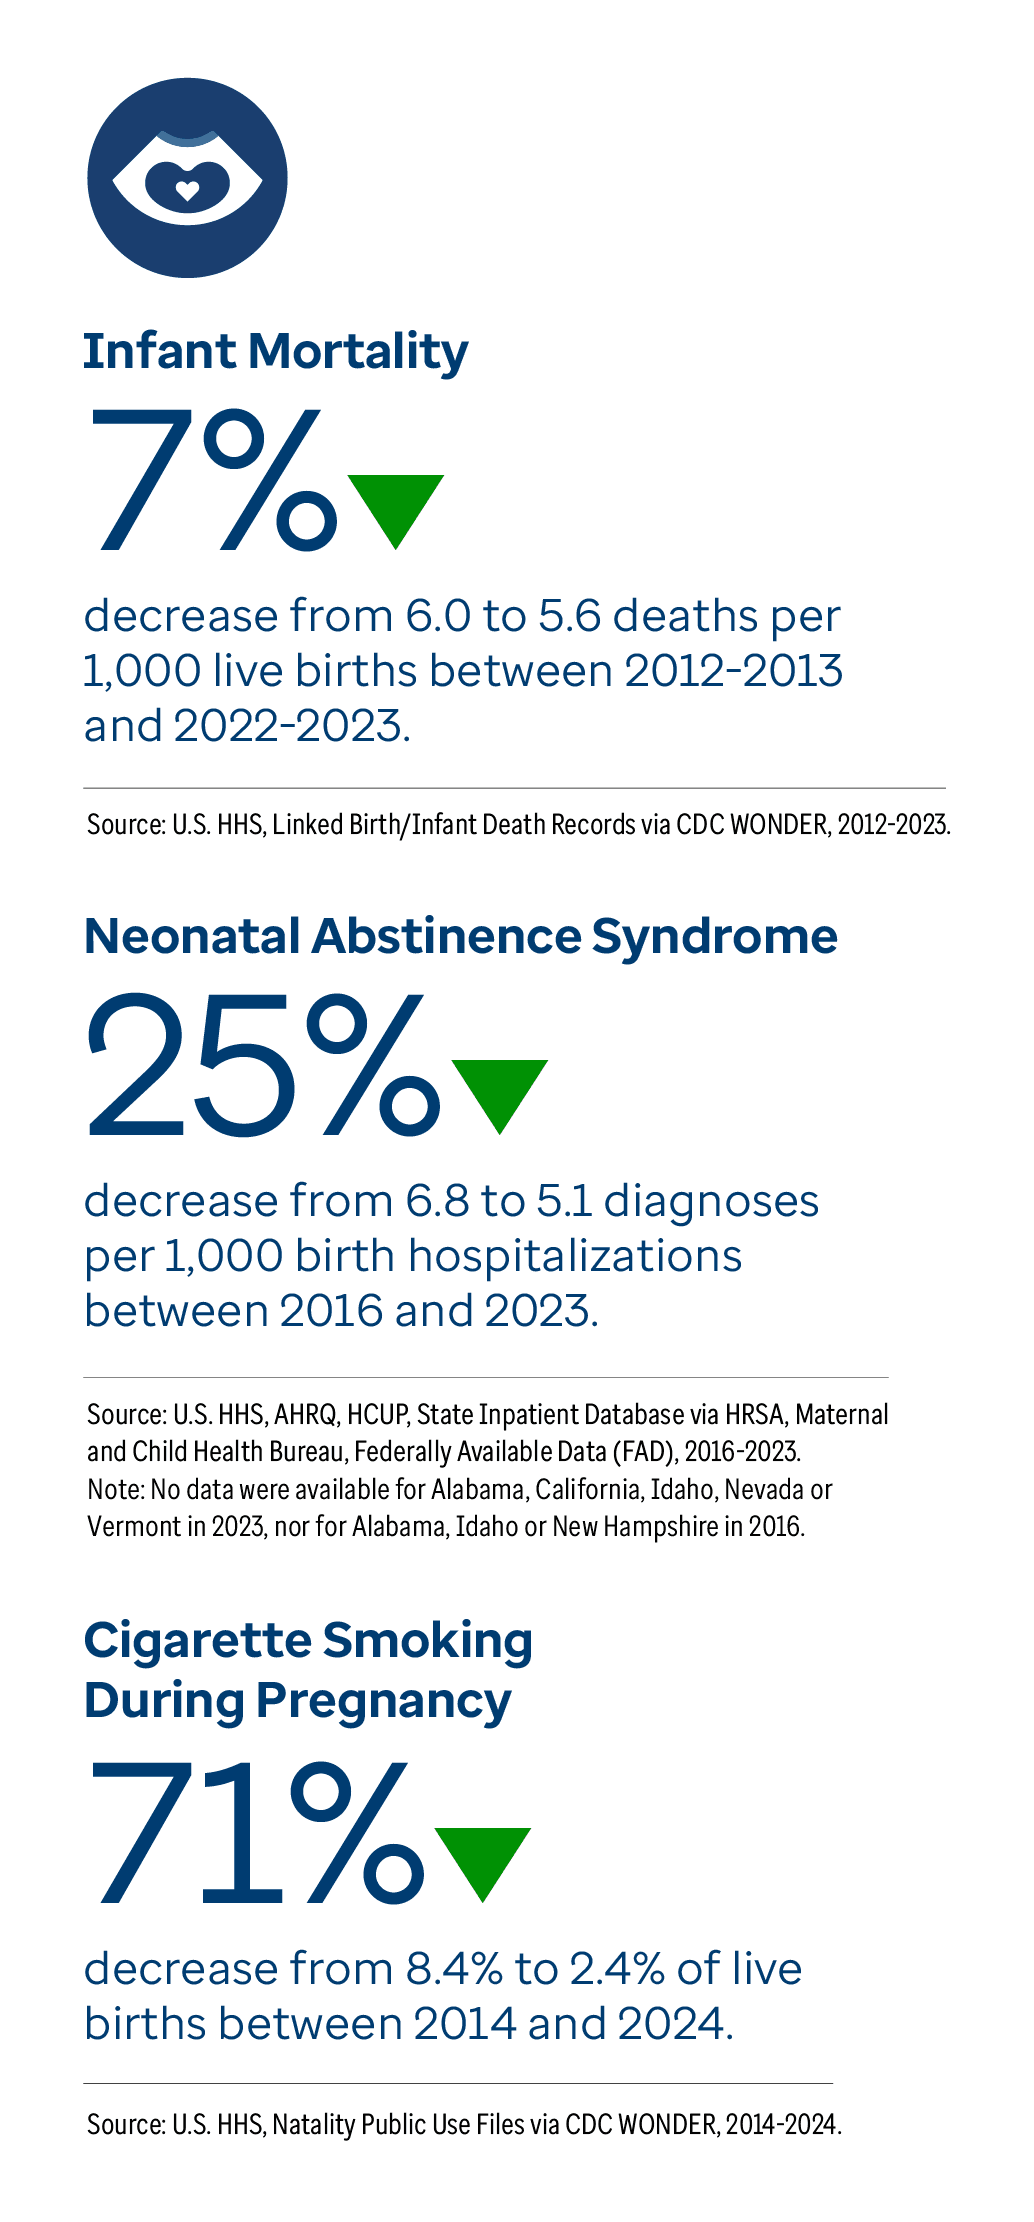
infant mortality.As a bright spot, the infant mortality rate improved 7% from 6.0 to 5.6 infant deaths per 1,000 live births between 2012-2013 and 2022-2023, approaching the
Healthy People 2030 Leading Health Indicator target of 5.0 deaths per 1,000 live births. Further, neonatal abstinence syndrome (NAS) — drug withdrawal symptoms occurring in newborns due to prenatal exposure to illicit drug use — decreased 25% from 6.8 to 5.1 diagnoses per 1,000 birth hospitalizations between 2016 and 2023. The NAS rate decreased 26% among infants living in nonmetropolitan areas (9.4 to 7.0), compared with 13% among infants living in large metropolitan areas (4.7 to 4.1) during the same time period. NAS can cause
long-term complications in children, such as developmental delays, growth problems and hearing and vision problems, making this an important area of progress.
Several behaviors associated with maternal and infant health also improved. The percentage of infants exclusively breastfed for six months increased 27% from 21.9% to 27.9% between the 2012 and 2022 birth cohorts. Cigarette smoking during pregnancy — a behavior
linked to complications including preterm birth and low birth weight — decreased 71% from 8.4% to 2.4% of live births between 2014 and 2024. Further improvement efforts are needed in some demographic groups more than others: Cigarette smoking during pregnancy was 3.1 times higher among mothers in nonmetropolitan, or rural, areas (5.8%) compared with mothers in metropolitan areas (1.9%) in 2024.
In another success, the teen birth rate improved substantially over the decade, decreasing 48% from 24.2 to 12.6 births per 1,000 females ages 15-19 between 2014 and 2024. The decrease in teen births represents meaningful progress in a measure closely linked with both maternal and child well-being.
“Improving maternal and infant health requires both ensuring women can access high-quality clinical care when they need it and strengthening the supports that shape health beyond the clinic or hospital.”
– Michael Warren, MD, MPH, FAAP
Chief Medical and Health Officer, March of Dimes
Mental health challenges and injury-related deaths rose among women
Mental health challenges increased among women of reproductive age over the past decade. The percentage of women ages 18-44 who reported their mental health was not good 14 or more days in the past 30 days increased 62% from 14.3% to 23.2% between 2013-2014 and 2023-2024. This measure of frequent mental distress significantly increased in 49 states and the District of Columbia during the same time period. Frequent mental distress more than doubled among women with an annual household income of $50,000 to $74,999 (increasing 154%, from 9.7% to 24.6%) during this time period — the largest increase of any income group.
Moreover, depression increased 23% from 24.8% to 30.6% of women ages 18-44 between 2017-2018 and 2023-2024. Postpartum mental health also remains an important consideration: 11.9% of women with a recent live birth, more than 318,000 women, reported experiencing postpartum depression symptoms in 2023.
High health status, an important measure of overall women’s health, also worsened across the decade. The percentage of women ages 18-44 who reported their overall health was very good or excellent decreased 12% from 56.0% to 49.4% between 2013-2014 and 2023-2024.
In addition, injury deaths among women worsened over the long term. The injury death rate increased 47% from 31.9 to 47.0 deaths due to injury per 100,000 women ages 20-44 between 2012-2014 and 2022-2024, but decreased 2% in the most recent period, shifting from 48.1 in 2019-2021 to 47.0 in 2022-2024.
America’s Health Rankings analysis of Centers for Disease Control and Prevention (CDC) data finds unintentional injuries consistently remained the
leading cause of death among women ages 20-44 between 2014 and 2024, largely driven by drug deaths.
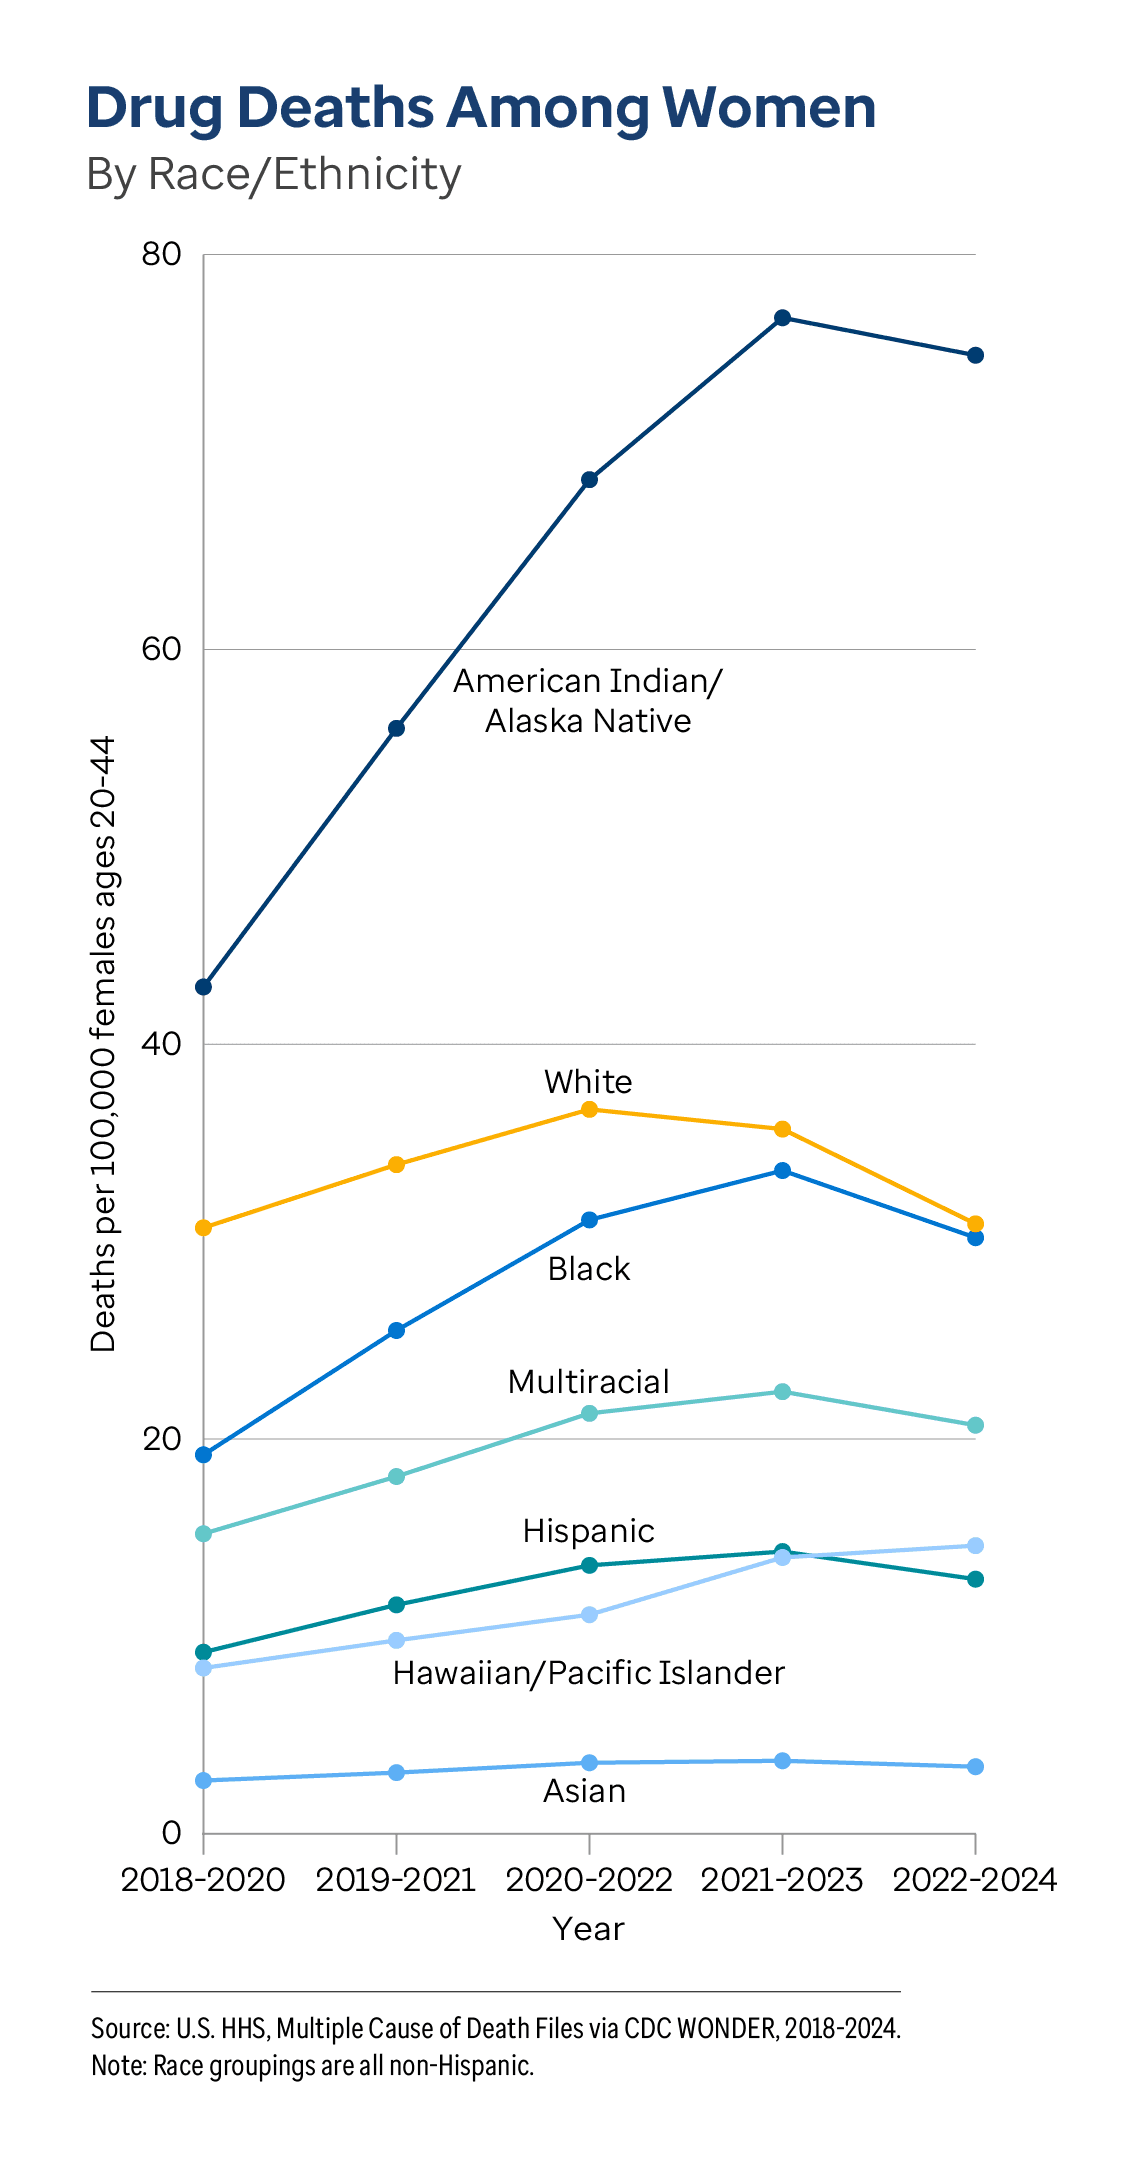
Drug deaths (including homicides, suicides, unintentional deaths and deaths due to unknown intent) increased 50% from 16.7 to 25.0 deaths per 100,000 women ages 20-44 between 2014-2016 and 2022-2024. However, the rate improved for the first time in a decade between 2019-2021 and 2022-2024, decreasing 3% from 25.7 to 25.0. Trends varied by race and ethnicity; the drug death rate increased 75% among American Indian/Alaska Native (42.9 to 74.9), 57% among Black (19.2 to 30.2), 40% among Hispanic (9.2 to 12.9), 36% among multiracial (15.2 to 20.7) and 26% among Asian (2.7 to 3.4) women but remained stable among white women (30.7 to 30.9) between 2018-2020 and 2022-2024.
Other leading causes of death among women ages 20-44 remained relatively consistent across the decade. Cancer was No. 2, heart disease No. 3 and suicide No. 4 in most years. In 2021, COVID-19 became the No. 2 cause of death, temporarily shifting cancer, heart disease and suicide to Nos. 3, 4 and 5, respectively.
Mental health challenges and mortality rates also increased among children and teens
Despite some recent improvements in child and adolescent mental health, other mental health trends worsened, as did mortality rates. Suicide remained a leading cause of death among adolescents over the decade. Between 2012-2014 and 2022-2024, the teen suicide rate increased 15% from 8.4 to 9.7 deaths due to intentional self-harm per 100,000 adolescents ages 15-19. However, in the most recent period, the rate decreased 8% from 10.6 in 2019-2021 to 9.7 in 2022-2024. Rates varied widely across states: In 2022-2024, the teen suicide rate was 6.5 times higher in Alaska (29.7) than in Massachusetts (4.6).
Risk factors associated with suicide among adolescents include mental and behavioral health conditions, academic stress,
frequent social media use and family factors such as violence at home.
Overall, the child mortality rate increased 18% from 24.3 to 28.7 deaths per 100,000 children ages 1-19 between 2012-2014 and 2022-2024. Unintentional injuries were the
leading cause of death among children ages 1-19 over the decade, and child injury deaths overall (including suicides and homicides) increased 25% from 14.2 to 17.8 deaths per 100,000 between 2012-2014 and 2022-2024. Suicide and homicide remained the Nos. 2 and 3 leading causes of death among children over the decade.
Measures of children’s mental and emotional well-being have also worsened in the long term. Diagnosed mental health conditions increased 32% among children ages 3-17, from 15.5% to 20.5% between 2016-2017 and 2023-2024. Meanwhile, flourishing — the percentage of children consistently demonstrating curiosity, emotional resilience, self-regulation and a strong connection with caregivers — decreased 28% from 92.8% to 66.7% of children ages 6 months to 17 years during the same period. Of note, flourishing was significantly higher among girls (69.1%) than boys (64.5%) in 2023-2024. Many factors can influence whether or not a child is flourishing,
including parental capacity and family dynamics.
Chronic conditions worsened among women despite improvements in cigarette smoking, preventive care and insurance coverage
Some chronic conditions became more prevalent among women over the past decade, while trends in health behaviors were mixed. Obesity, defined as a body mass index (BMI) of 30.0 or higher, increased 26% from 25.9% to 32.6% of women ages 18-44 between 2013-2014 and 2023-2024. Obesity increased 50% among women with college degrees, rising from 18.2% to 27.3%, the largest increase by educational attainment. Diabetes also increased 16% from 3.1% to 3.6% of women ages 18-44 between 2013-2014 and 2023-2024. During the same time period, physical inactivity among women ages 18-44 remained unchanged, affecting 22.5% of women ages 18-44 in 2013-2014 and 22.0% in 2023-2024.
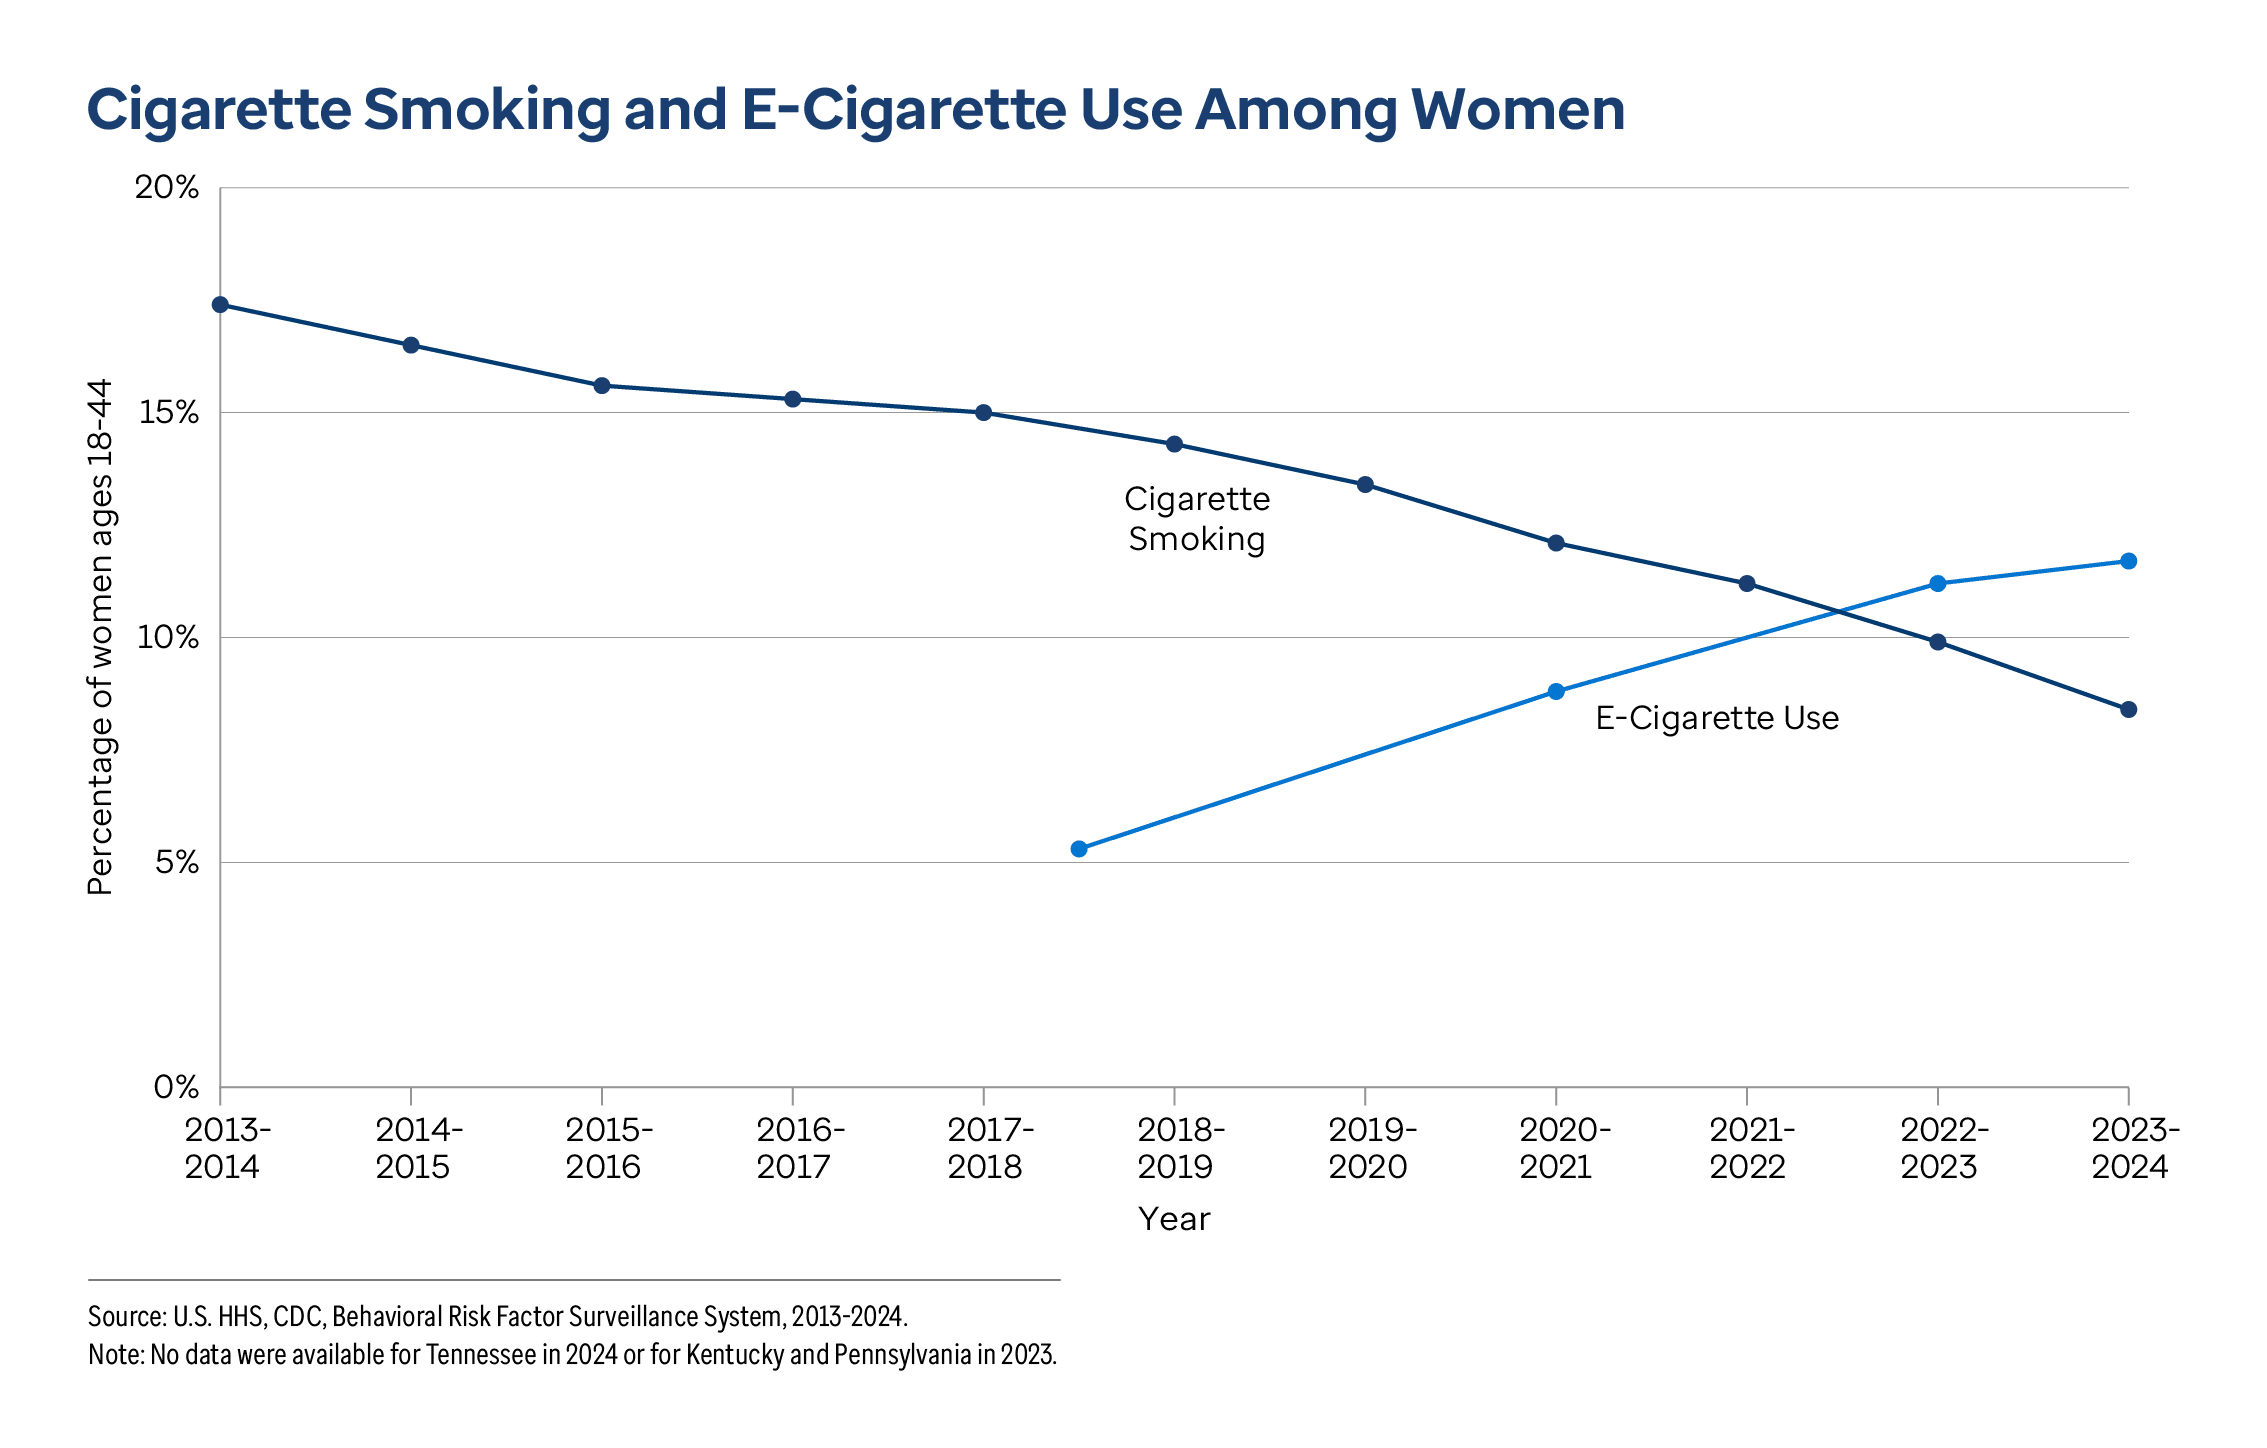
Other health behaviors have shifted over the decade. Cigarette smoking decreased 52% from 17.4% to 8.4% of women ages 18-44 between 2013-2014 and 2023-2024. This decrease represents meaningful long-term progress in a key health behavior; smoking affects
nearly every organ and can cause cancer, heart disease, stroke, diabetes and respiratory conditions such as chronic obstructive pulmonary disease (COPD). However, in contrast to cigarette smoking, e-cigarette use increased 121% among women ages 18-44, from 5.3% in 2018 to 11.7% in 2023-2024.
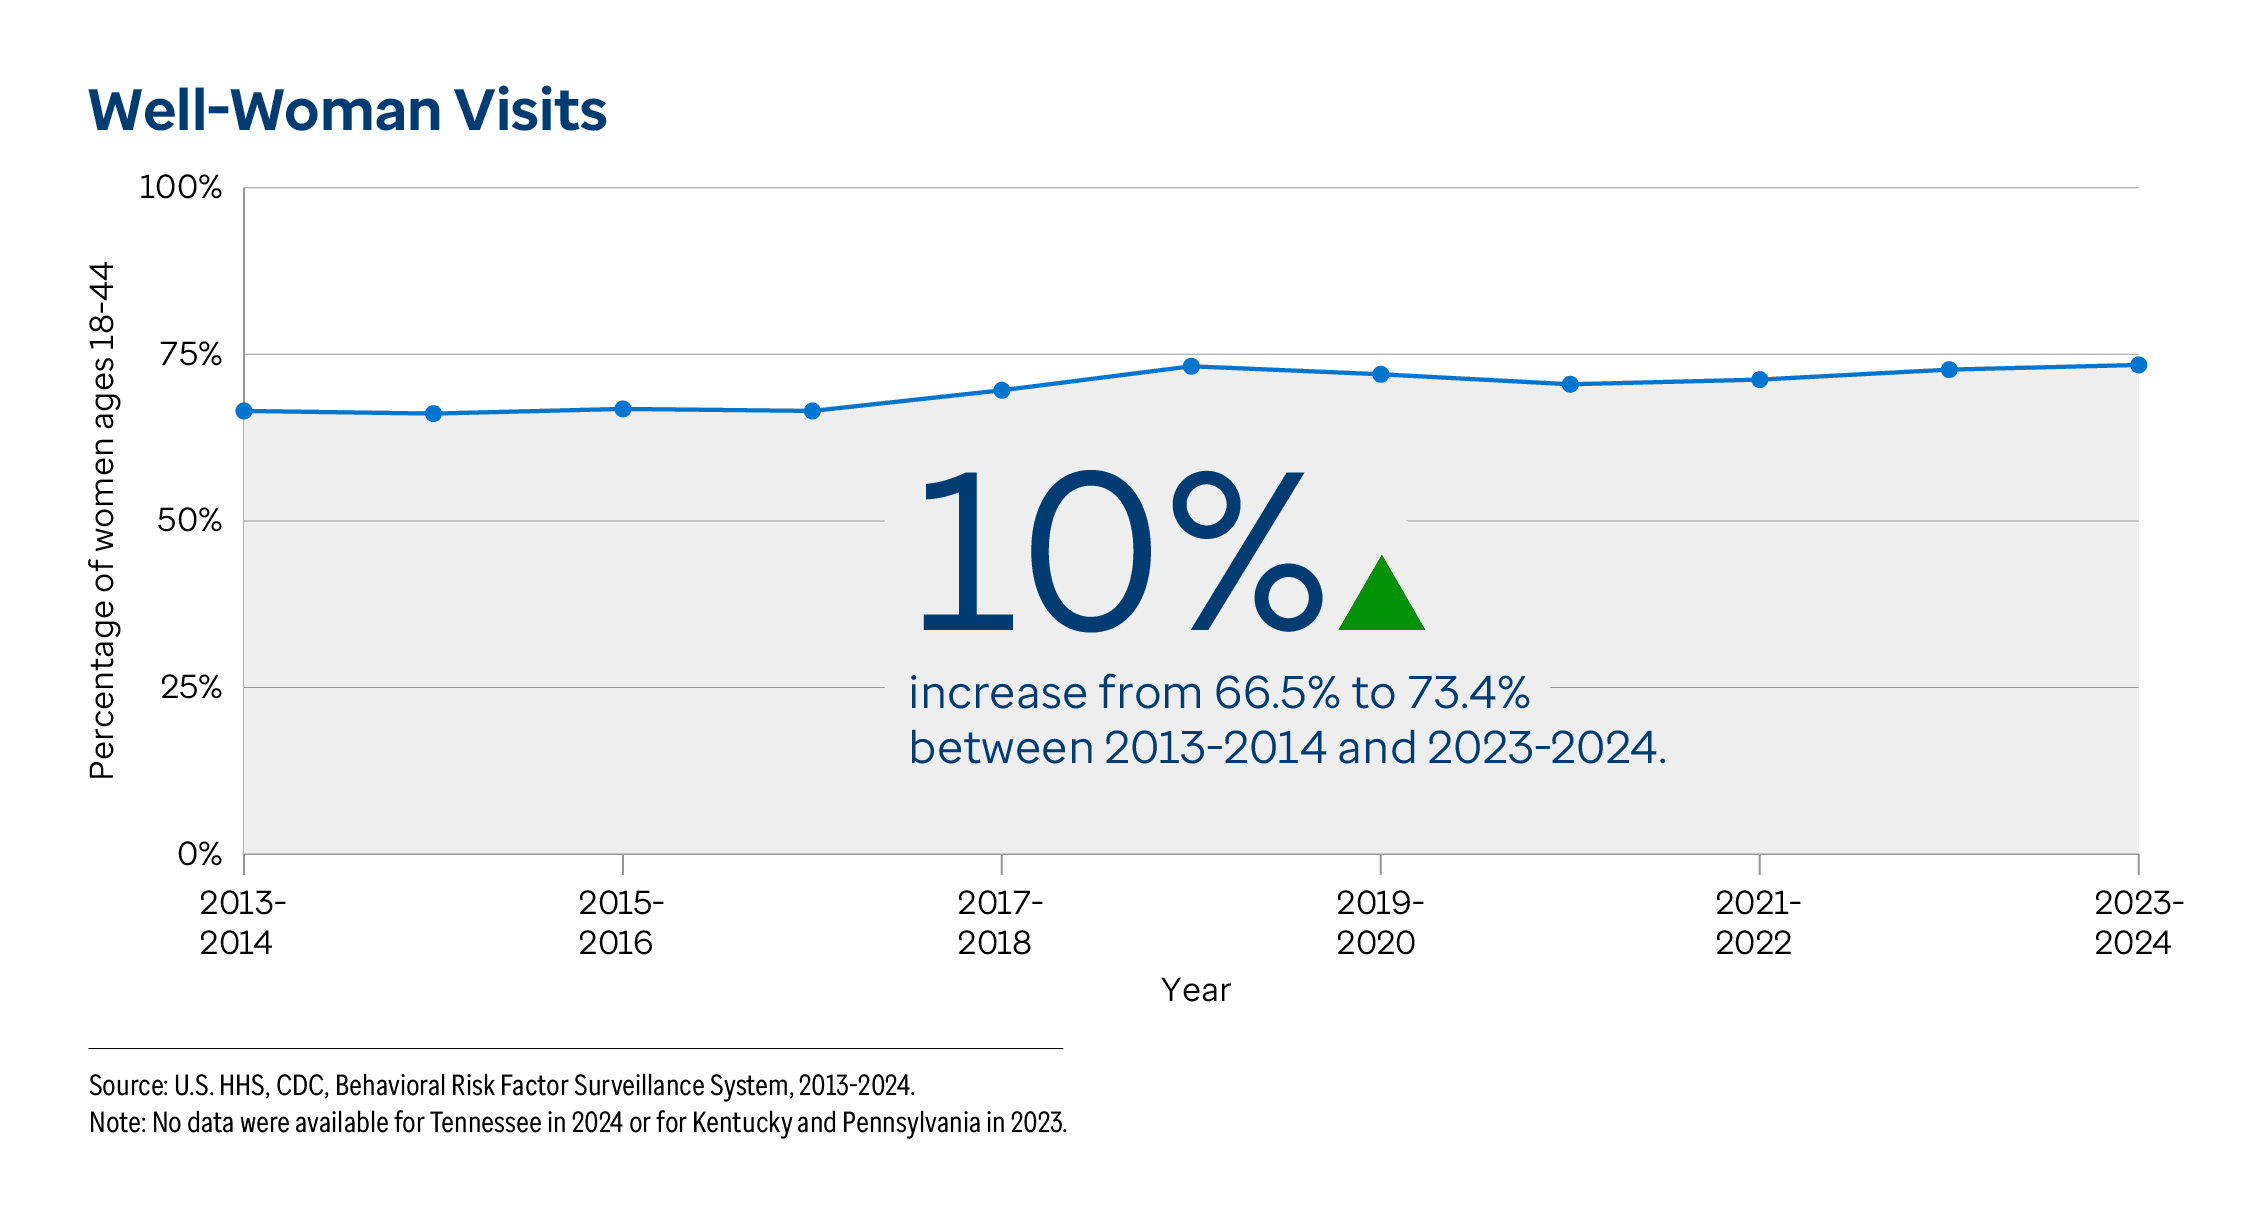
Measures of preventive clinical services and access to care showed some improvement. Well-woman visits — the percentage of women ages 18-44 who had a preventive medical visit in the past year — increased 10% from 66.5% to 73.4% between 2013-2014 and 2023-2024. These
annual health exams provide an opportunity for women to access preventive services like
screening tests, gain referrals to specialist providers and
discuss strategies to minimize health risks.
The uninsured rate decreased 10% from 12.4% to 11.2% of women ages 19-44 between 2017 and 2024, representing an improvement in the proportion of women who have health insurance. Despite this improvement, cost remained a barrier to receiving care: In 2023-2024, 18.5% of women ages 18-44 reported a time in the past 12 months when they needed to see a doctor but could not because of cost.
Children’s physical activity and access to care declined despite growth in the pediatric workforce
Measures of children’s physical health and health behaviors showed limited progress in recent years. Physical activity decreased 14% among children ages 6-17, from 23.0% to 19.7% between 2016-2017 and 2023-2024. Meanwhile, overweight or obesity remained unchanged, affecting 32.3% of children ages 6-17 in 2016-2017 and 31.3% in 2023-2024.
Access to health care among children also showed signs of worsening. The percentage of children younger than 19 years without private or public health insurance increased 20% from 5.0% in 2017 to 6.0% in 2024. Well-child visits (the percentage of children receiving at least one preventive medical visit in the last year) decreased 3% from 82.1% to 79.6% of children ages 0-17 between 2016-2017 and 2023-2024. The prevalence of well-child visits was higher among children with a caregiver who graduated from college (86.7%) than children whose caregivers had less than a high school education (59.5%) in 2023-2024.
As a bright spot, the number of pediatricians increased 18% from 100.1 to 118.2 per 100,000 children ages 0-21 between September 2019 and September 2025. Despite overall gains, the number of pediatricians was 4.4 times higher in Massachusetts (224.2) than in Idaho (51.3) in September 2025. Uneven geographic distribution of pediatricians and family physicians still leaves many
rural communities and other underserved areas with insufficient child health care options, making continued action important to improve access to care nationwide.
“When health care providers, schools, families and communities reinforce one another, guidance can become action, and consistent healthy behaviors can become part of children’s everyday lives and help them thrive as they grow up.”
– Traci Causey, PhD, MBA, MCHES
CEO of the Alliance for a Healthier Generation
Food insecurity and housing costs worsened alongside improvements related to poverty and education
Social and economic conditions for women and children improved across several measures over the past decade, though recent increases in food insecurity and housing cost burden show that long-term gains can be lost.
The percentage of children younger than 18 years living in households below the poverty threshold decreased 29% from 21.7% to 15.5% between 2014 and 2024. The rate decreased 35% among Hispanic children (32.1% to 20.9%) during the same time period, the largest decrease by race/ethnicity. Poverty among women ages 18-44 also decreased 12% from 16.3% to 14.4% between 2018 and 2024. These improvements in poverty represent meaningful long-term progress, but continued action is needed to approach the
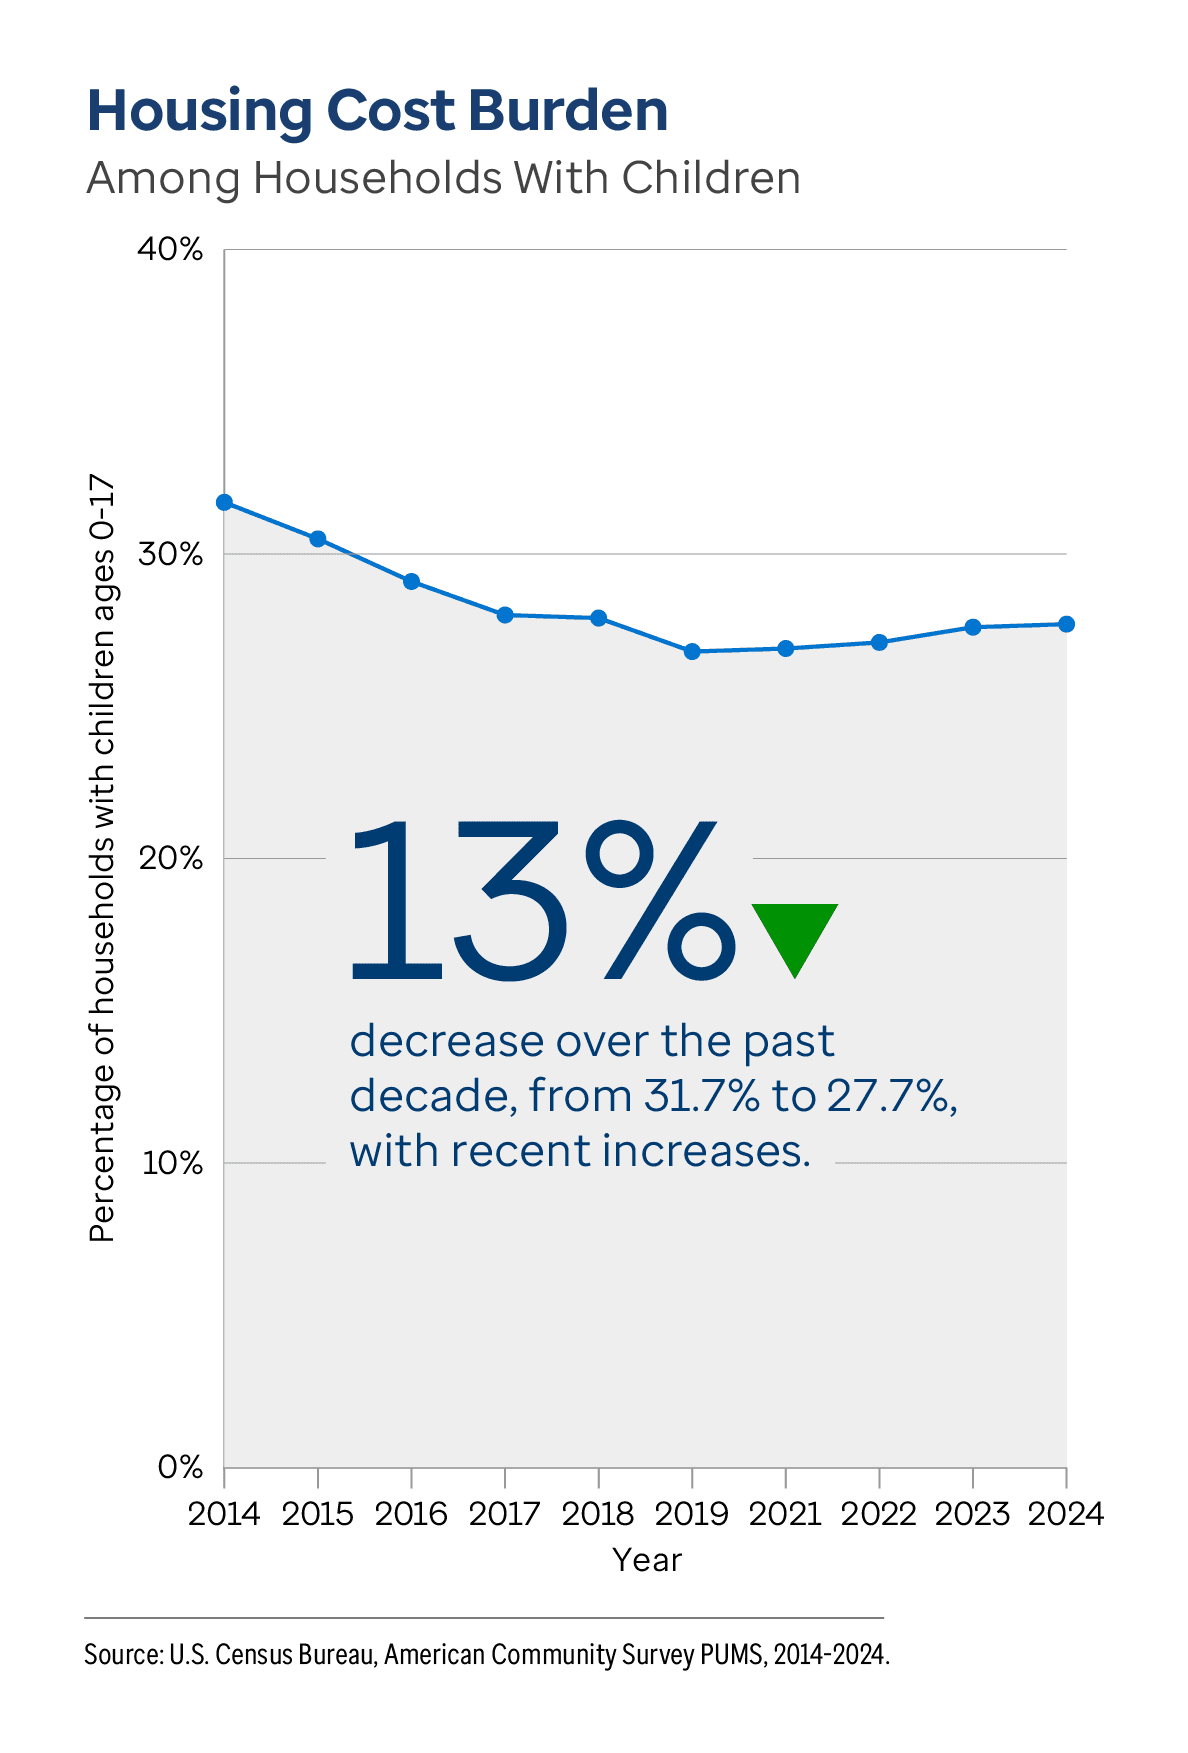
Healthy People 2030 target to reduce the proportion of people living in poverty to 8.0%.Housing cost burden also improved over the decade. The percentage of households with one or more children ages 0-17 spending more than 30% of household income on housing decreased 13% from 31.7% to 27.7% between 2014 and 2024. However, housing cost burden recently increased 3%, from 26.8% in 2019 to 27.7% in 2024. The stress of housing instability can have impacts on
physical and
mental health, especially for
children, underscoring the importance of sustaining long-term gains.
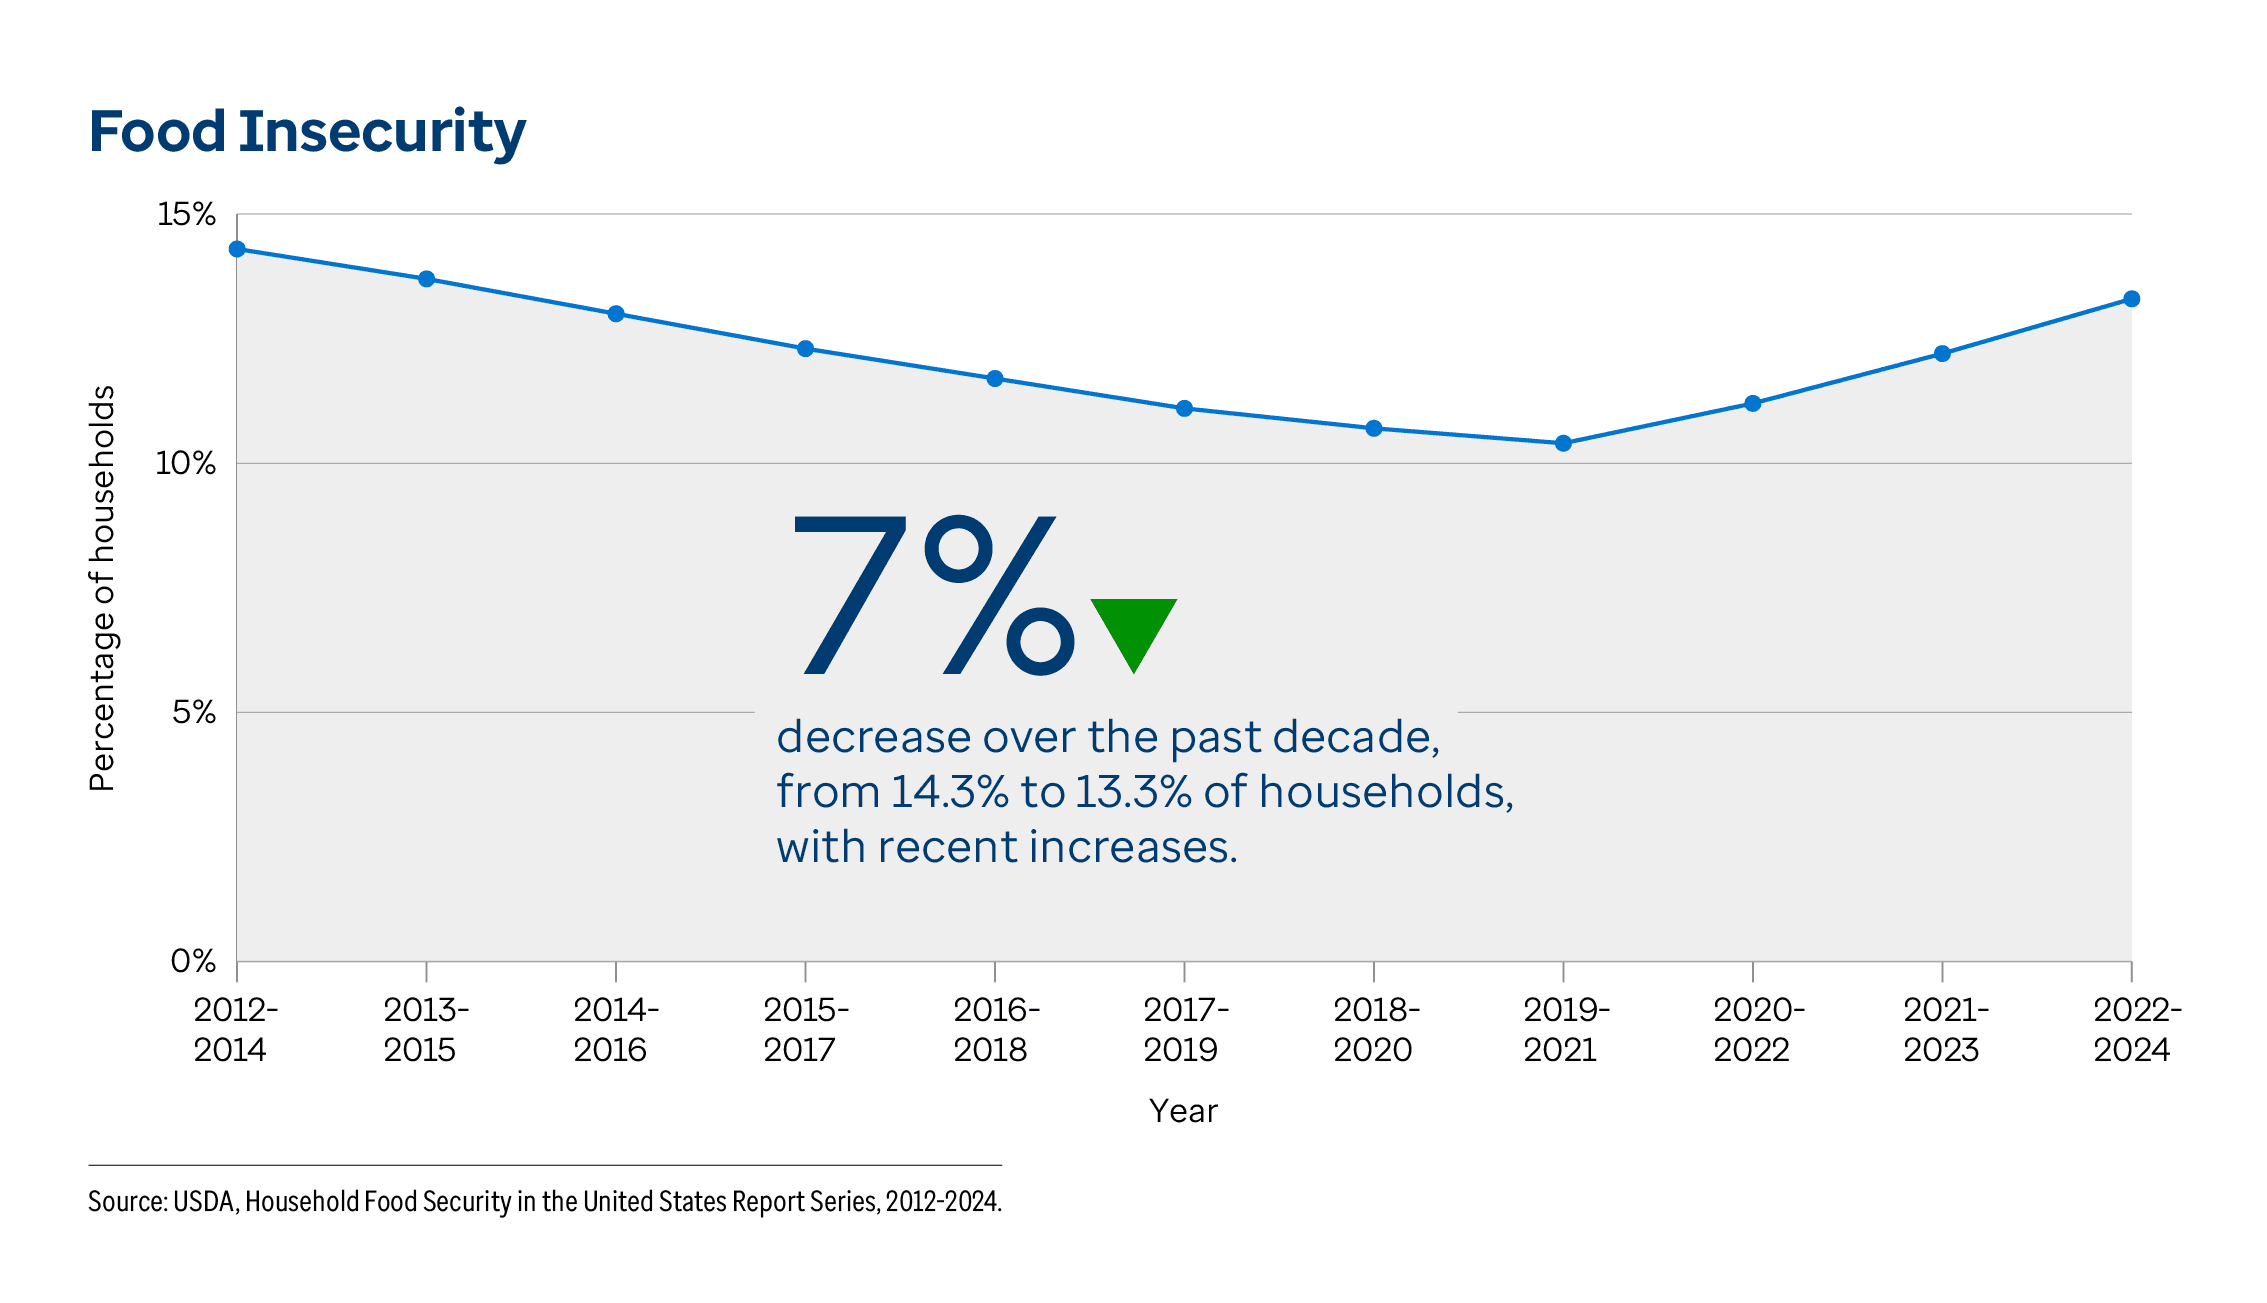
Food insecurity showed a similar pattern of long-term improvement followed by a recent reversal. The percentage of households unable to provide adequate food for one or more household members due to lack of resources decreased 7% from 14.3% in 2012-2014 to 13.3% in 2022-2024. However, food insecurity increased 28% in the most recent period, from 10.4% in 2019-2021 to 13.3% in 2022-2024. Children are particularly susceptible to the negative impacts of food insecurity because they are still
developing.Educational outcomes, which are tied to
higher earnings and better
self-reported health, also showed long-term progress. The high school graduation rate increased 7% between the 2012-2013 and 2022-2023 school years (81.4% to 86.7%). The increase was particularly large among Black students, whose graduation rate rose 16% from 70.7% to 82.0%, the largest increase by race/ethnicity.
State data and rankings can show where targeted action is needed
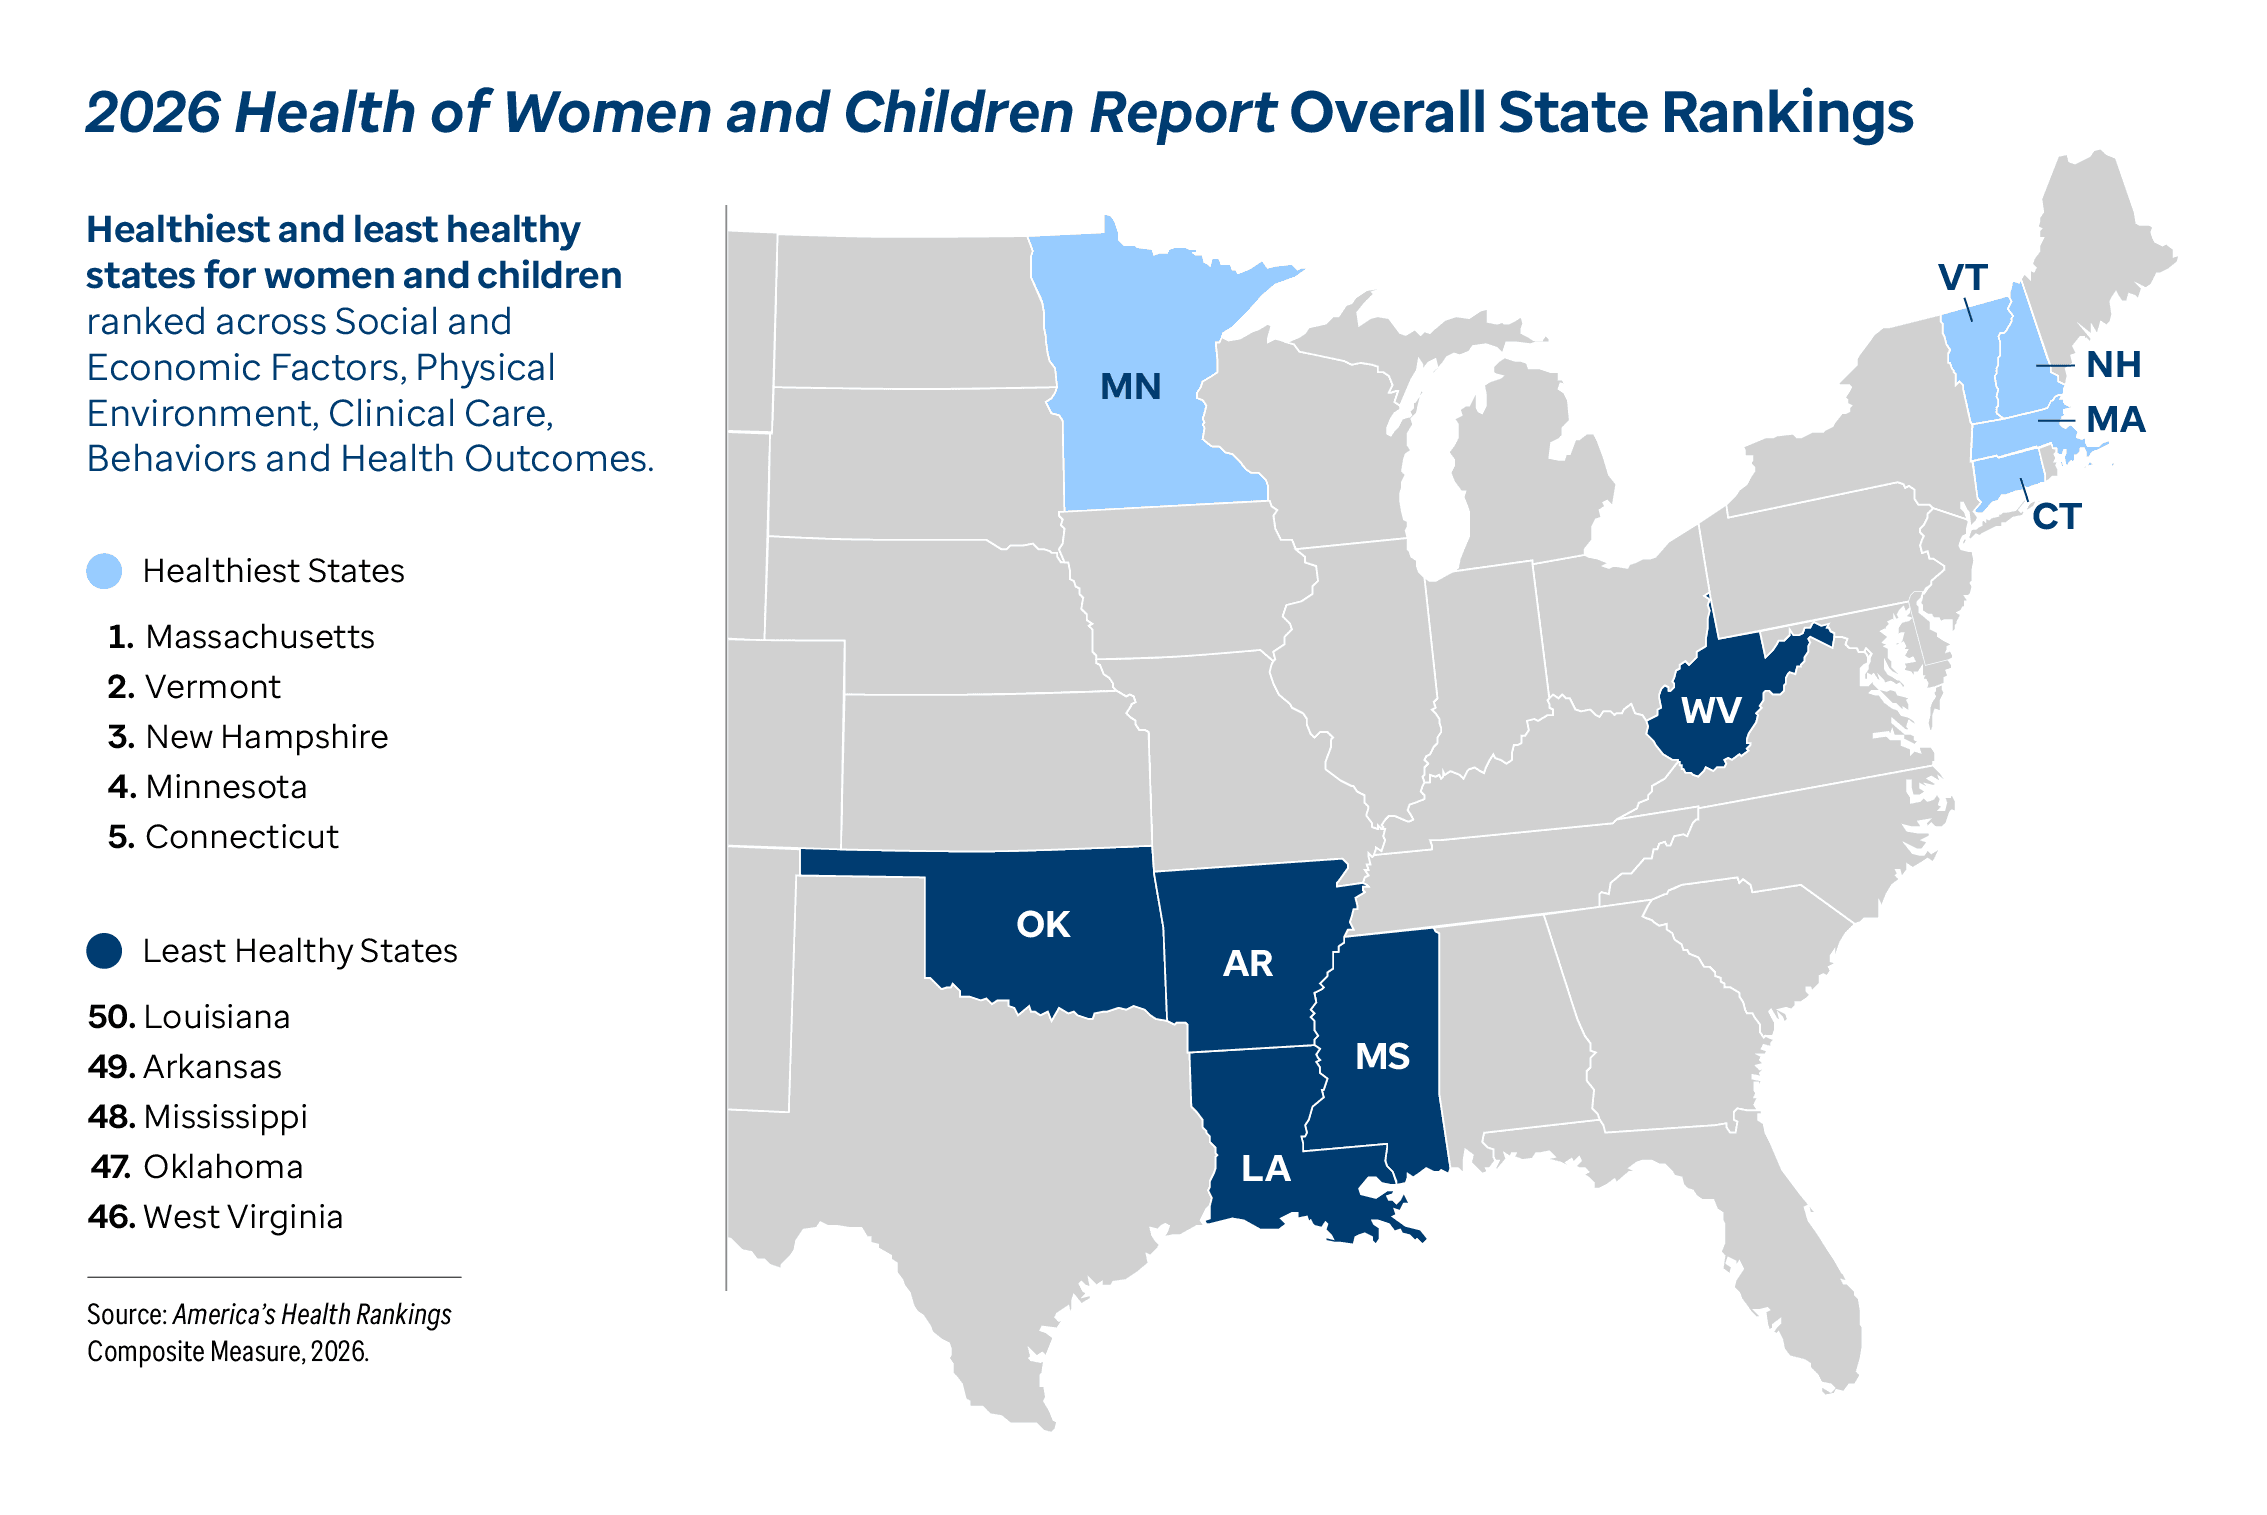
Since the publication of the first Health of Women and Children Report a decade ago, state rankings have provided a comprehensive view of health outcomes and the factors that shape them across the country. In this edition, the healthiest state for women and children was Massachusetts, followed by Vermont (No. 2), New Hampshire (No. 3), Minnesota (No. 4) and Connecticut (No. 5). Louisiana (No. 50) had the most room for improvement, followed by Arkansas (No. 49), Mississippi (No. 48), Oklahoma (No. 47) and West Virginia (No. 46).
Massachusetts, Vermont, New Hampshire, Minnesota and Connecticut have consistently remained in the top 10 healthiest states over the past decade, while Louisiana, Arkansas, Mississippi and Oklahoma have consistently ranked among the 10 least healthy.
State rankings over a decade
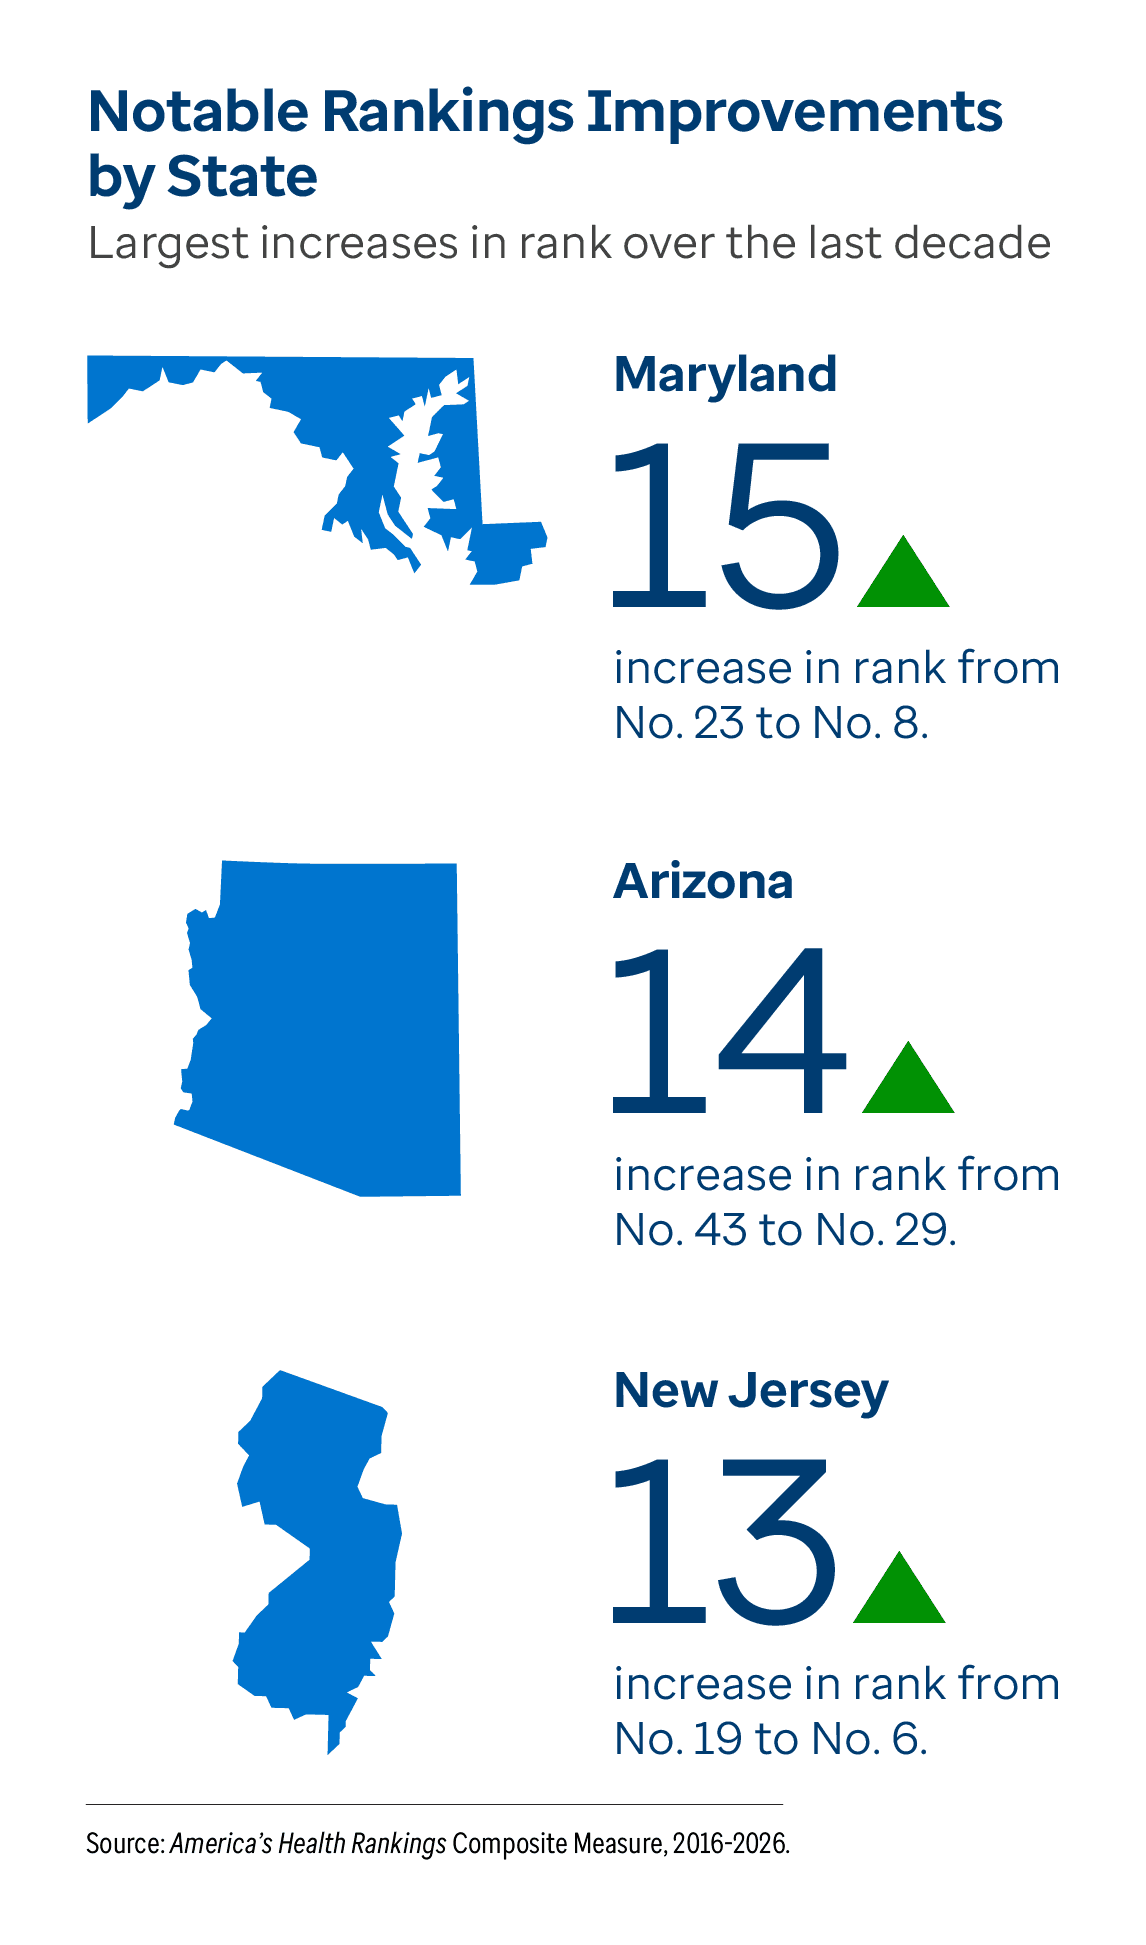
Several states made notable gains in rank, led by Maryland, which improved 15 places (No. 23 to No. 8), followed by Arizona (14 places; No. 43 to No. 29) and New Jersey (13 places; No. 19 to No. 6).
Three states’ rankings declined 10 or more places between 2016 and 2026: Maine fell 13 places (No. 11 to No. 24), Iowa, 12 places (No. 8 to No. 20), and Kentucky, 11 places (No. 34 to No. 45).
Ten years of America’s Health Rankings analysis shows that meaningful progress in women’s and children’s health requires sustained focus. Long-term improvements in health behaviors, access to care and socioeconomic conditions reflect ongoing public health and clinical efforts, while persistent and emerging challenges reinforce the need for purposeful collaboration in a changing landscape. Leaders can use state data to target action where it is most needed, maintain momentum in areas showing improvement and help foster better health and well-being for women and children across the lifespan.

 US Summary
 Alabama
 Alaska
 Arizona
 Arkansas
 California
 Colorado
 Connecticut
 Delaware
 District of Columbia
 Florida
 Georgia
 Hawaii
 Idaho
Idaho Illinois
 Indiana
 Iowa
Iowa Kansas
 Kentucky
 Louisiana
 Maine
Maine Maryland
 Massachusetts
 Michigan
 Minnesota
 Mississippi
 Missouri
 Montana
 Nebraska
 Nevada
 New Hampshire
 New Jersey
 New Mexico
 New York
 North Carolina
 North Dakota
 Ohio
Ohio Oklahoma
 Oregon
 Pennsylvania
 Rhode Island
 South Carolina
 South Dakota
 Tennessee
 Texas
Texas Utah
Utah Vermont
 Virginia
 Washington
 West Virginia
 Wisconsin
 Wyoming