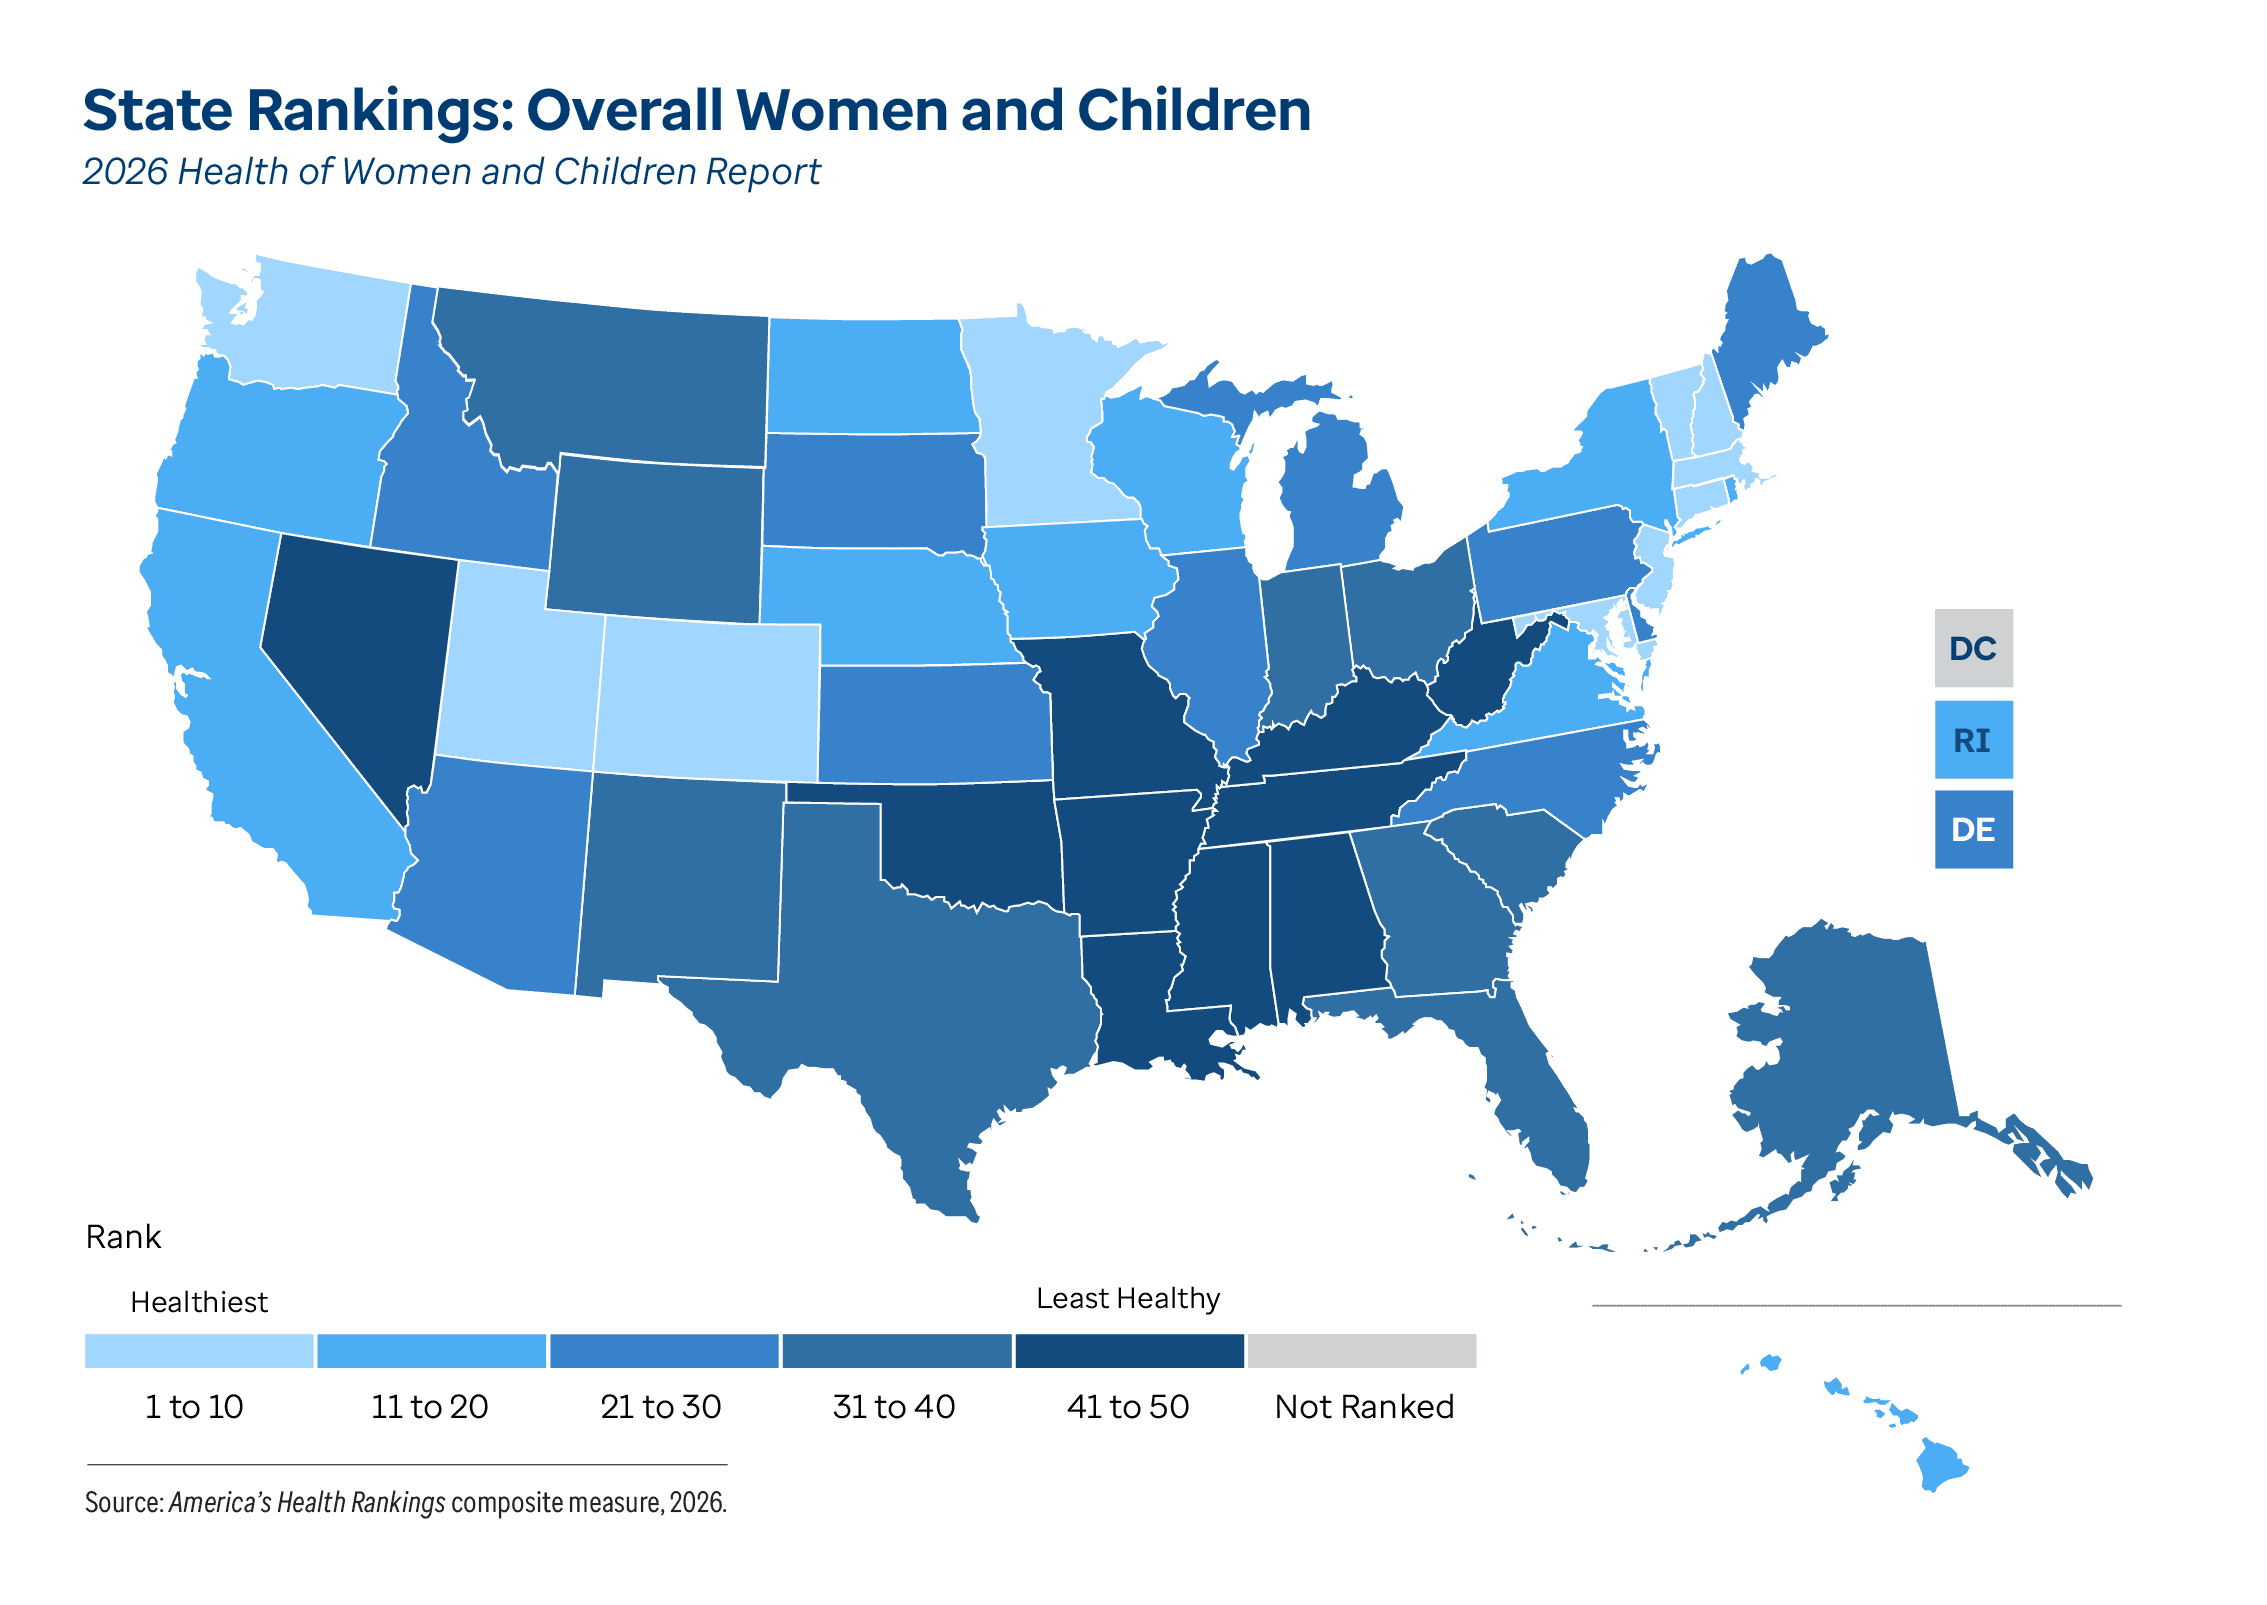
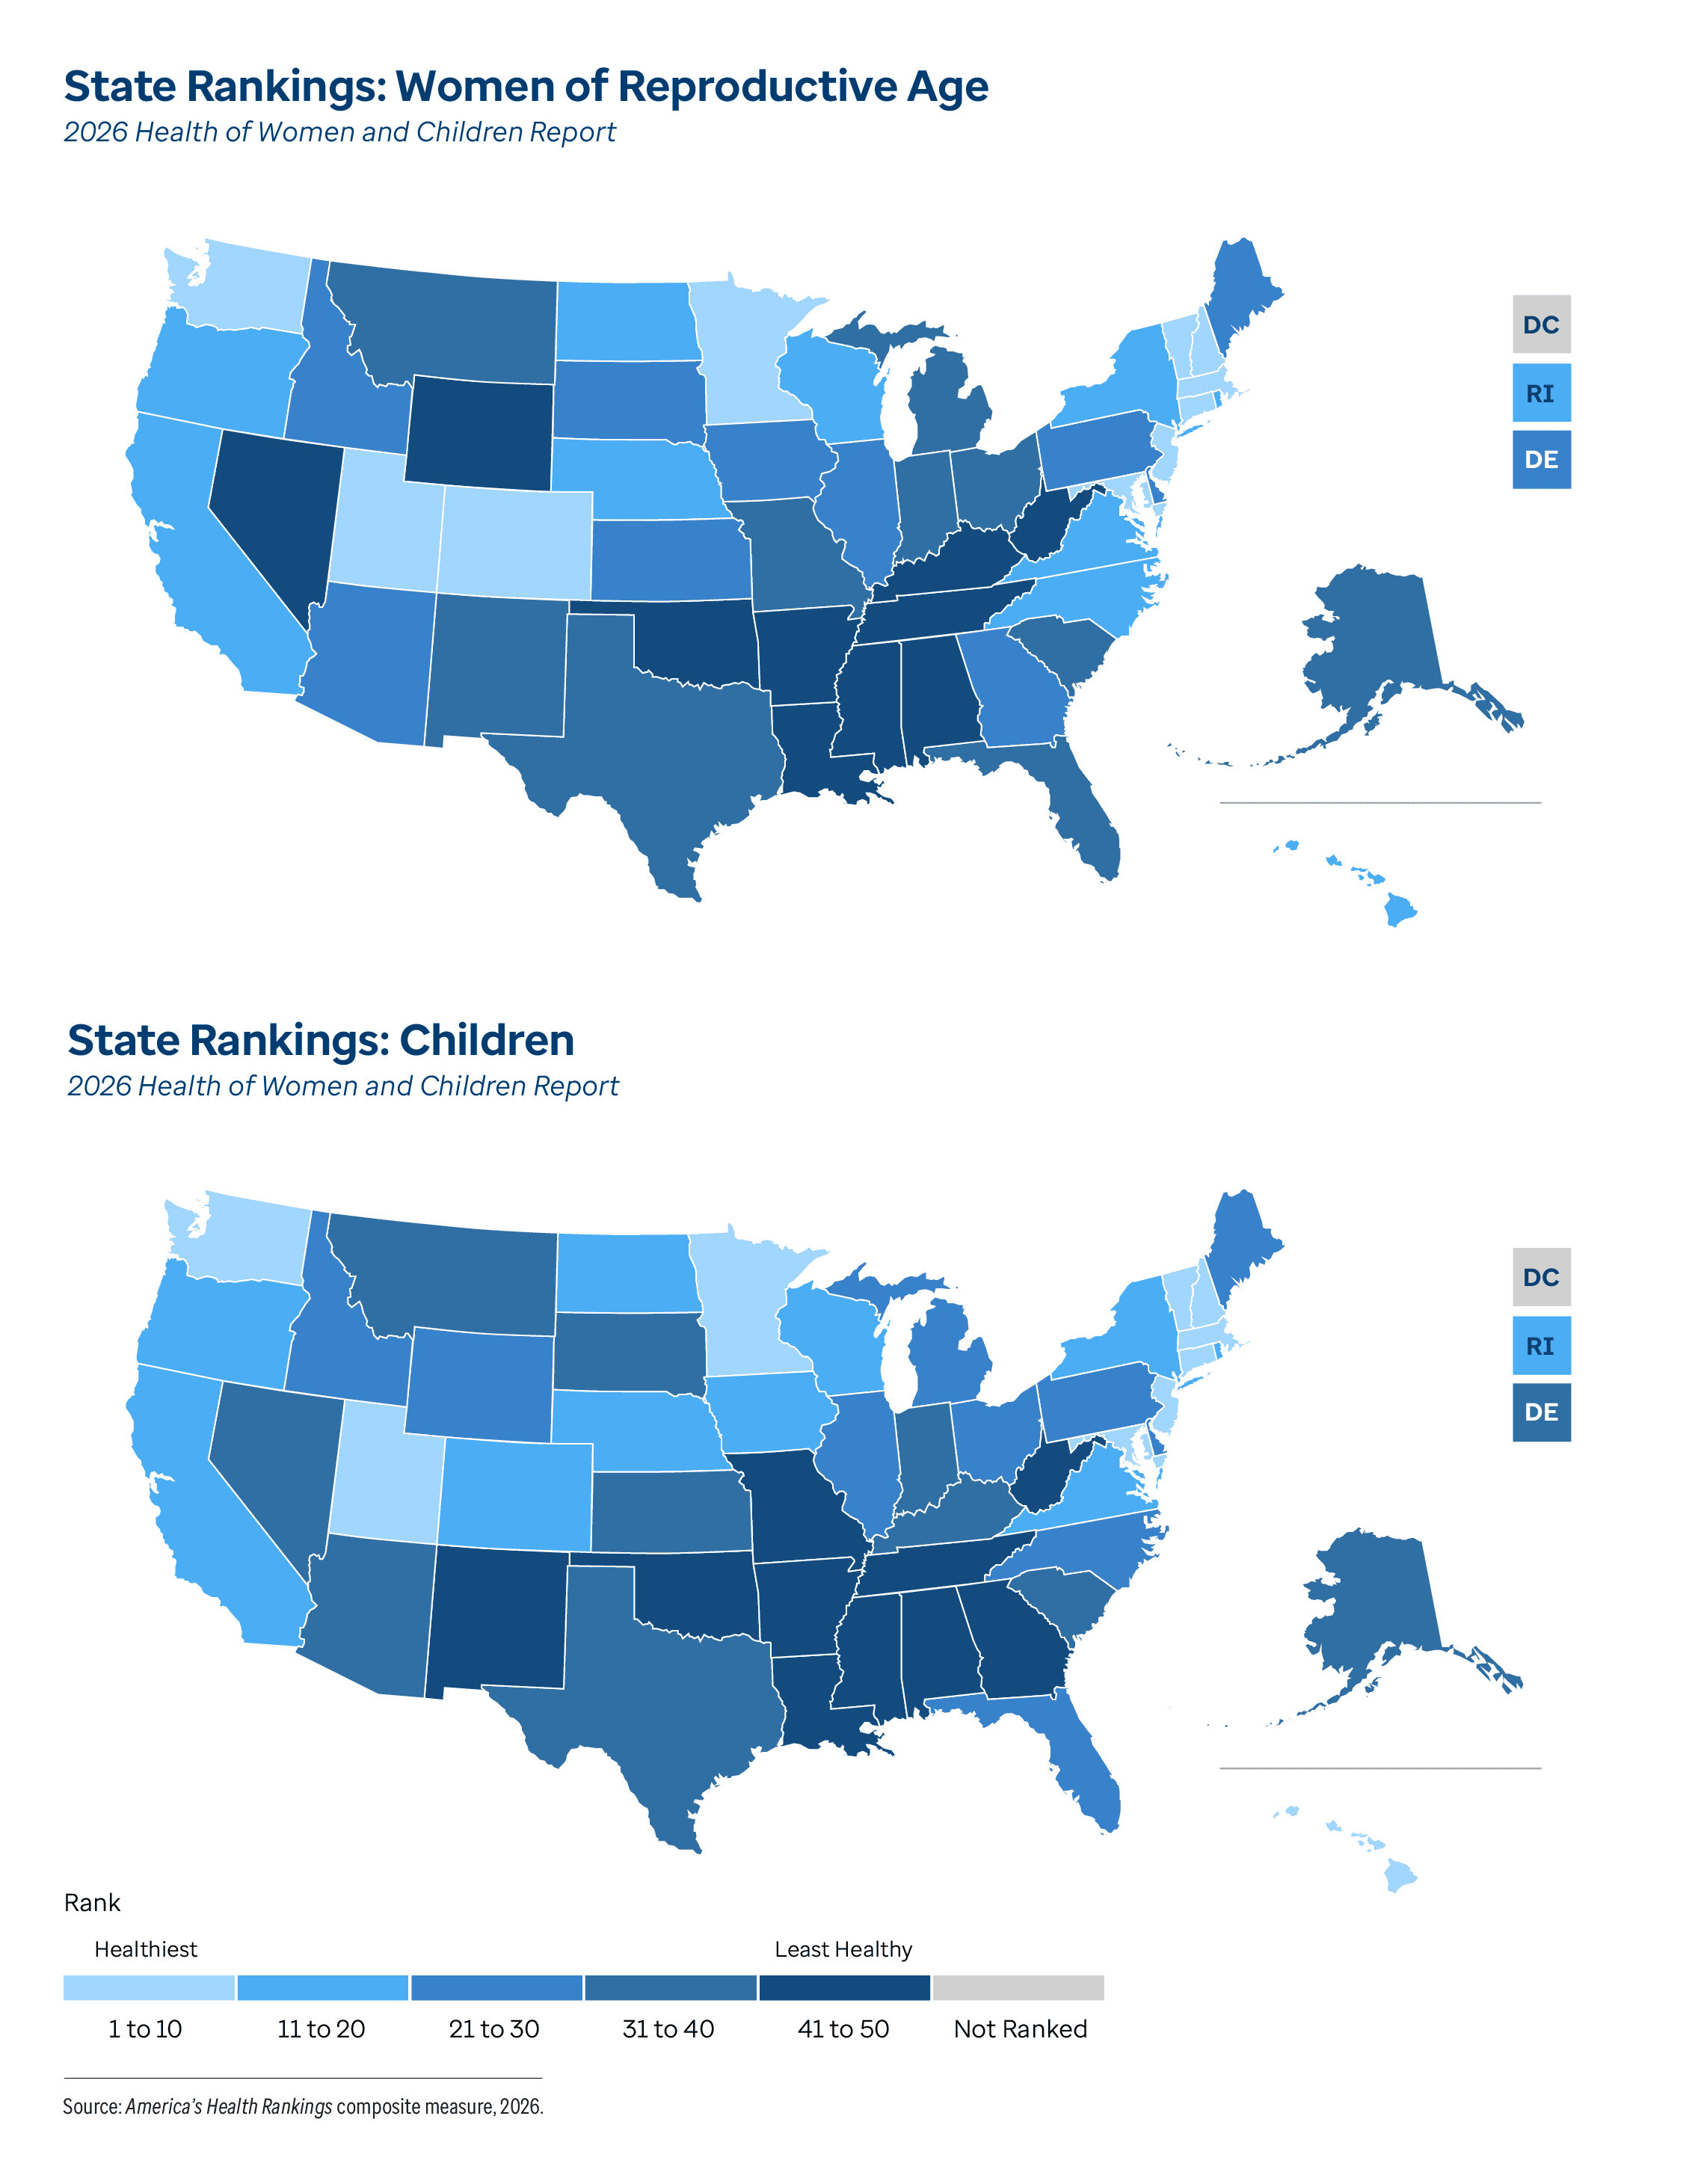
The overall state rankings are based on 83 measures across five categories of health: Social and Economic Factors, Physical Environment, Behaviors, Clinical Care and Health Outcomes. Additional information can be found on the
America’s Health Rankings Methodology page.
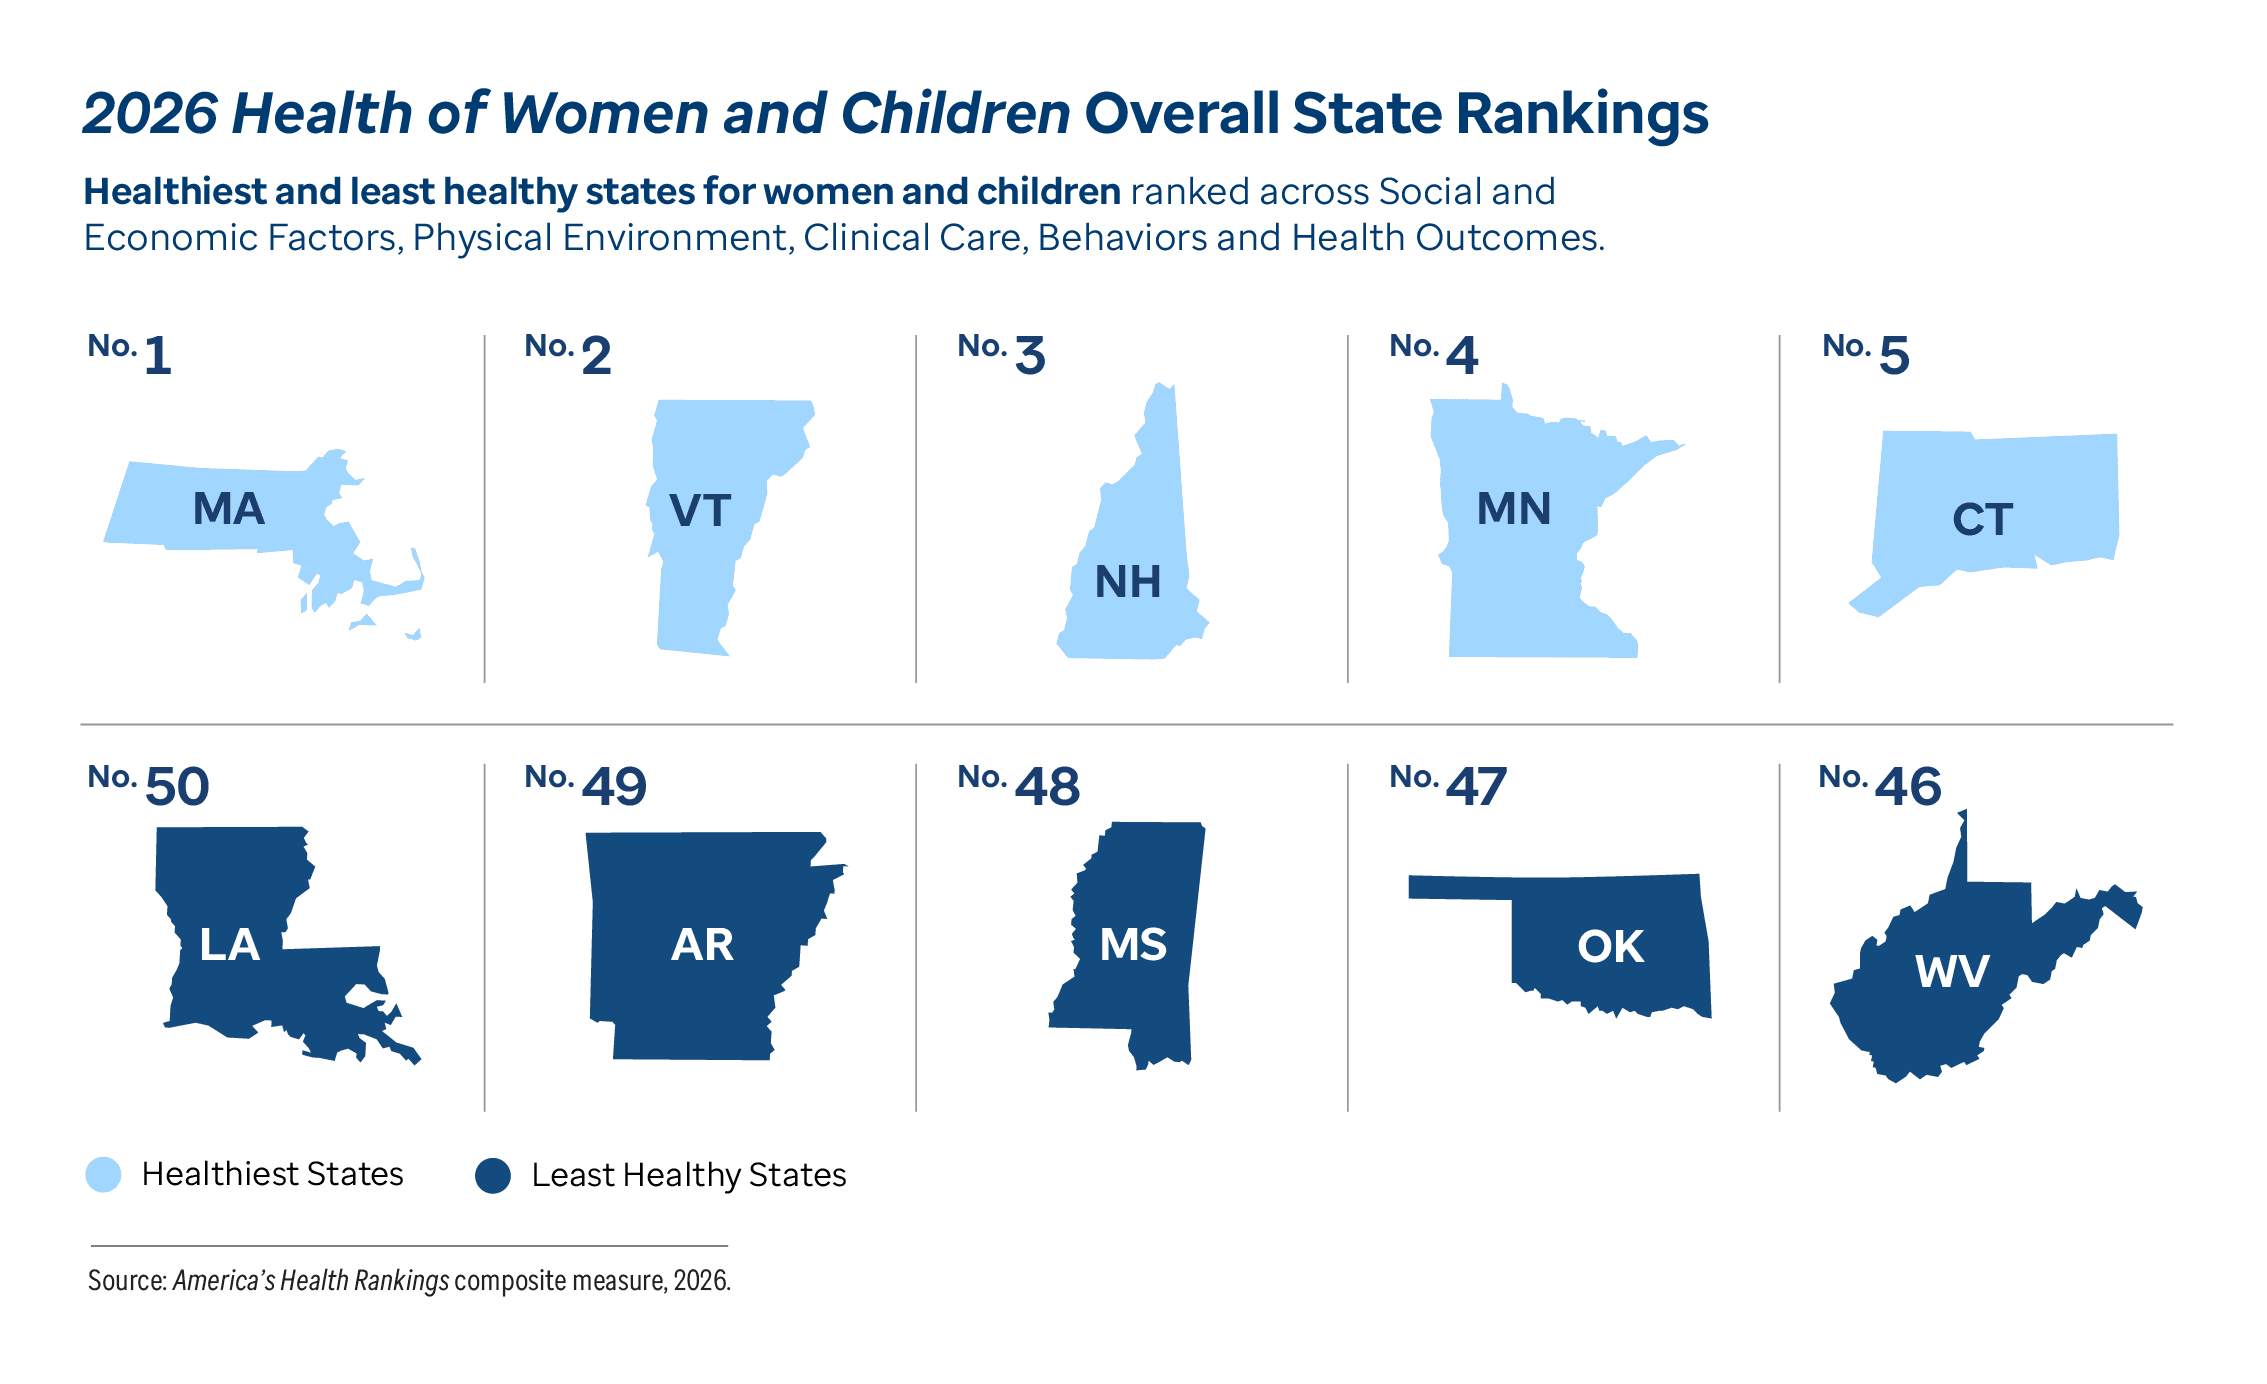
Massachusetts ranked No. 1
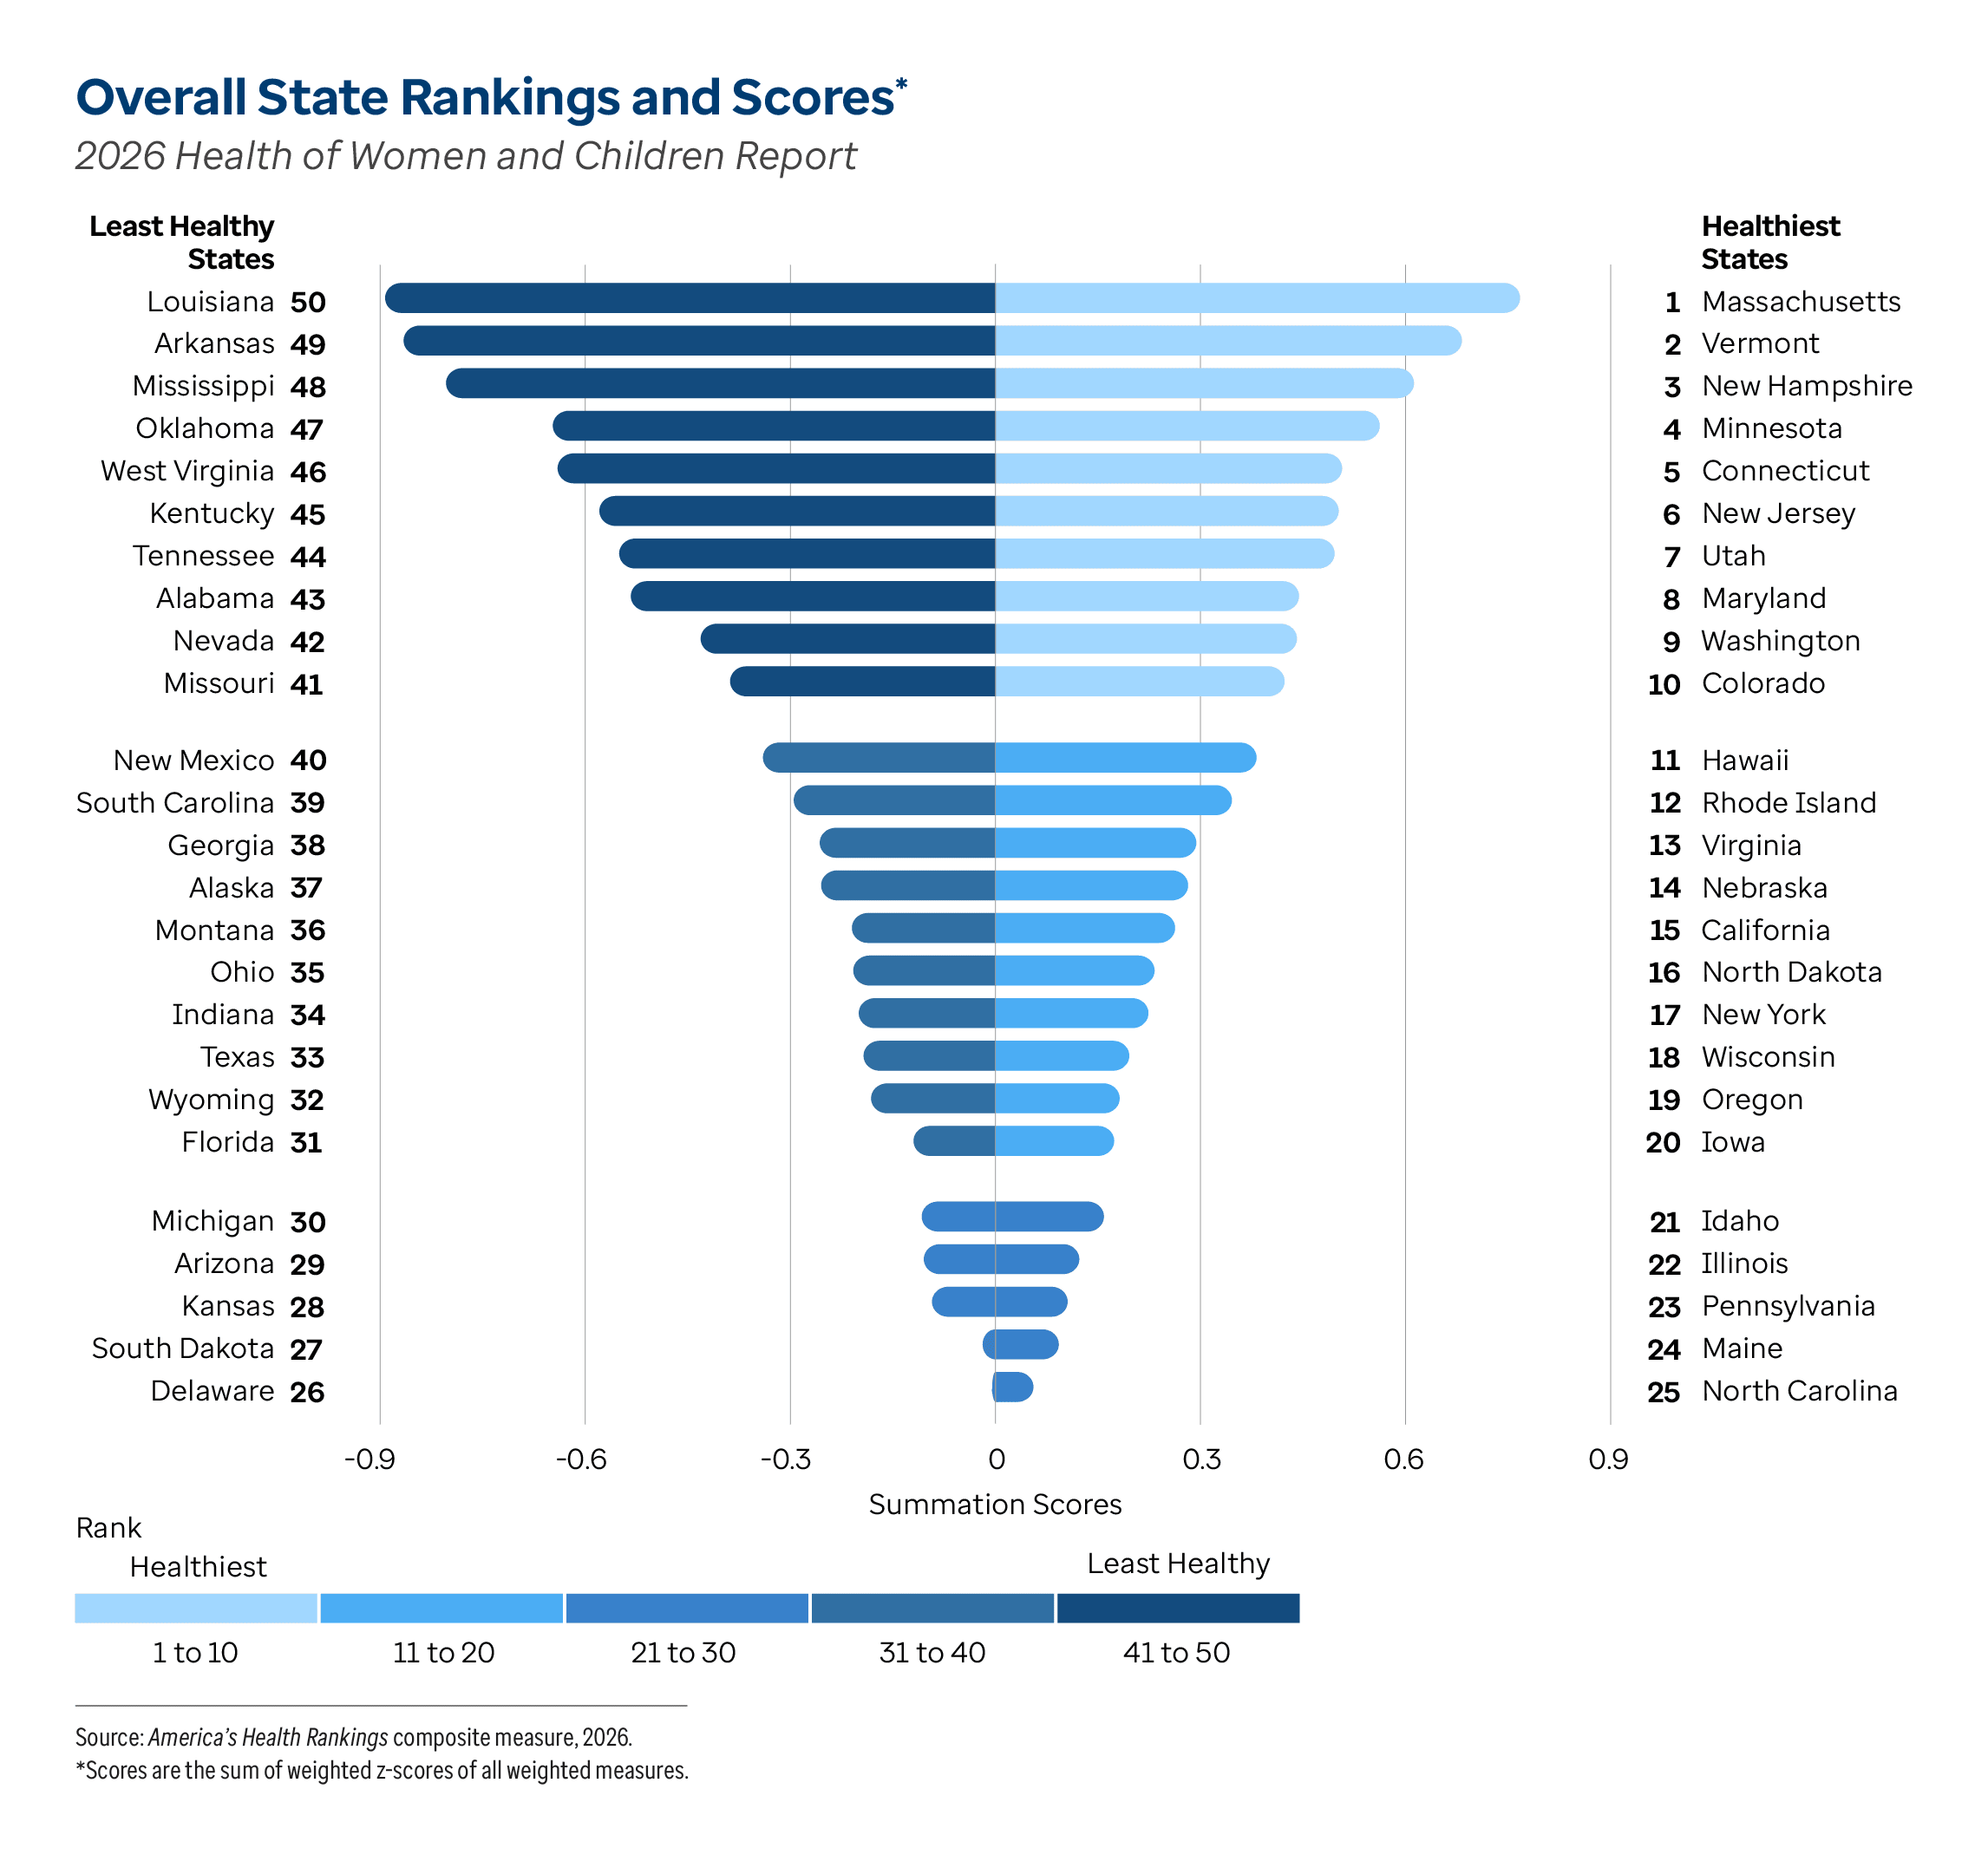
The graph above displays state scores and ranks, with the least healthy states on the left and the healthiest on the right. The distance between bars shows the difference between state scores. For example, while Oklahoma (No. 47) and Mississippi (No. 48) are adjacent in the rankings, there is a sizable difference in their overall scores. This indicates that Mississippi would need to show significant improvement across multiple measures to move up in the rankings. There is also a large gap in score between Nevada (No. 42) and Alabama (No. 43).
To further explore state-level data, see
Explore Data. The website features downloadable
State Summaries for each state and the District of Columbia. Each summary describes state-specific strengths, challenges, key findings and rankings for individual measures, allowing users to identify which measures positively or negatively influenced each state’s overall rank. This can be visualized by selecting a state in the Explore Data section. Disparity ratios, which show the relative difference between two groups within a demographic, are available for select measures in the website’s State Summaries. The website also features an
Adjust My Rank tool that allows users to explore how progress and challenges across key measures can impact a state’s overall rank.
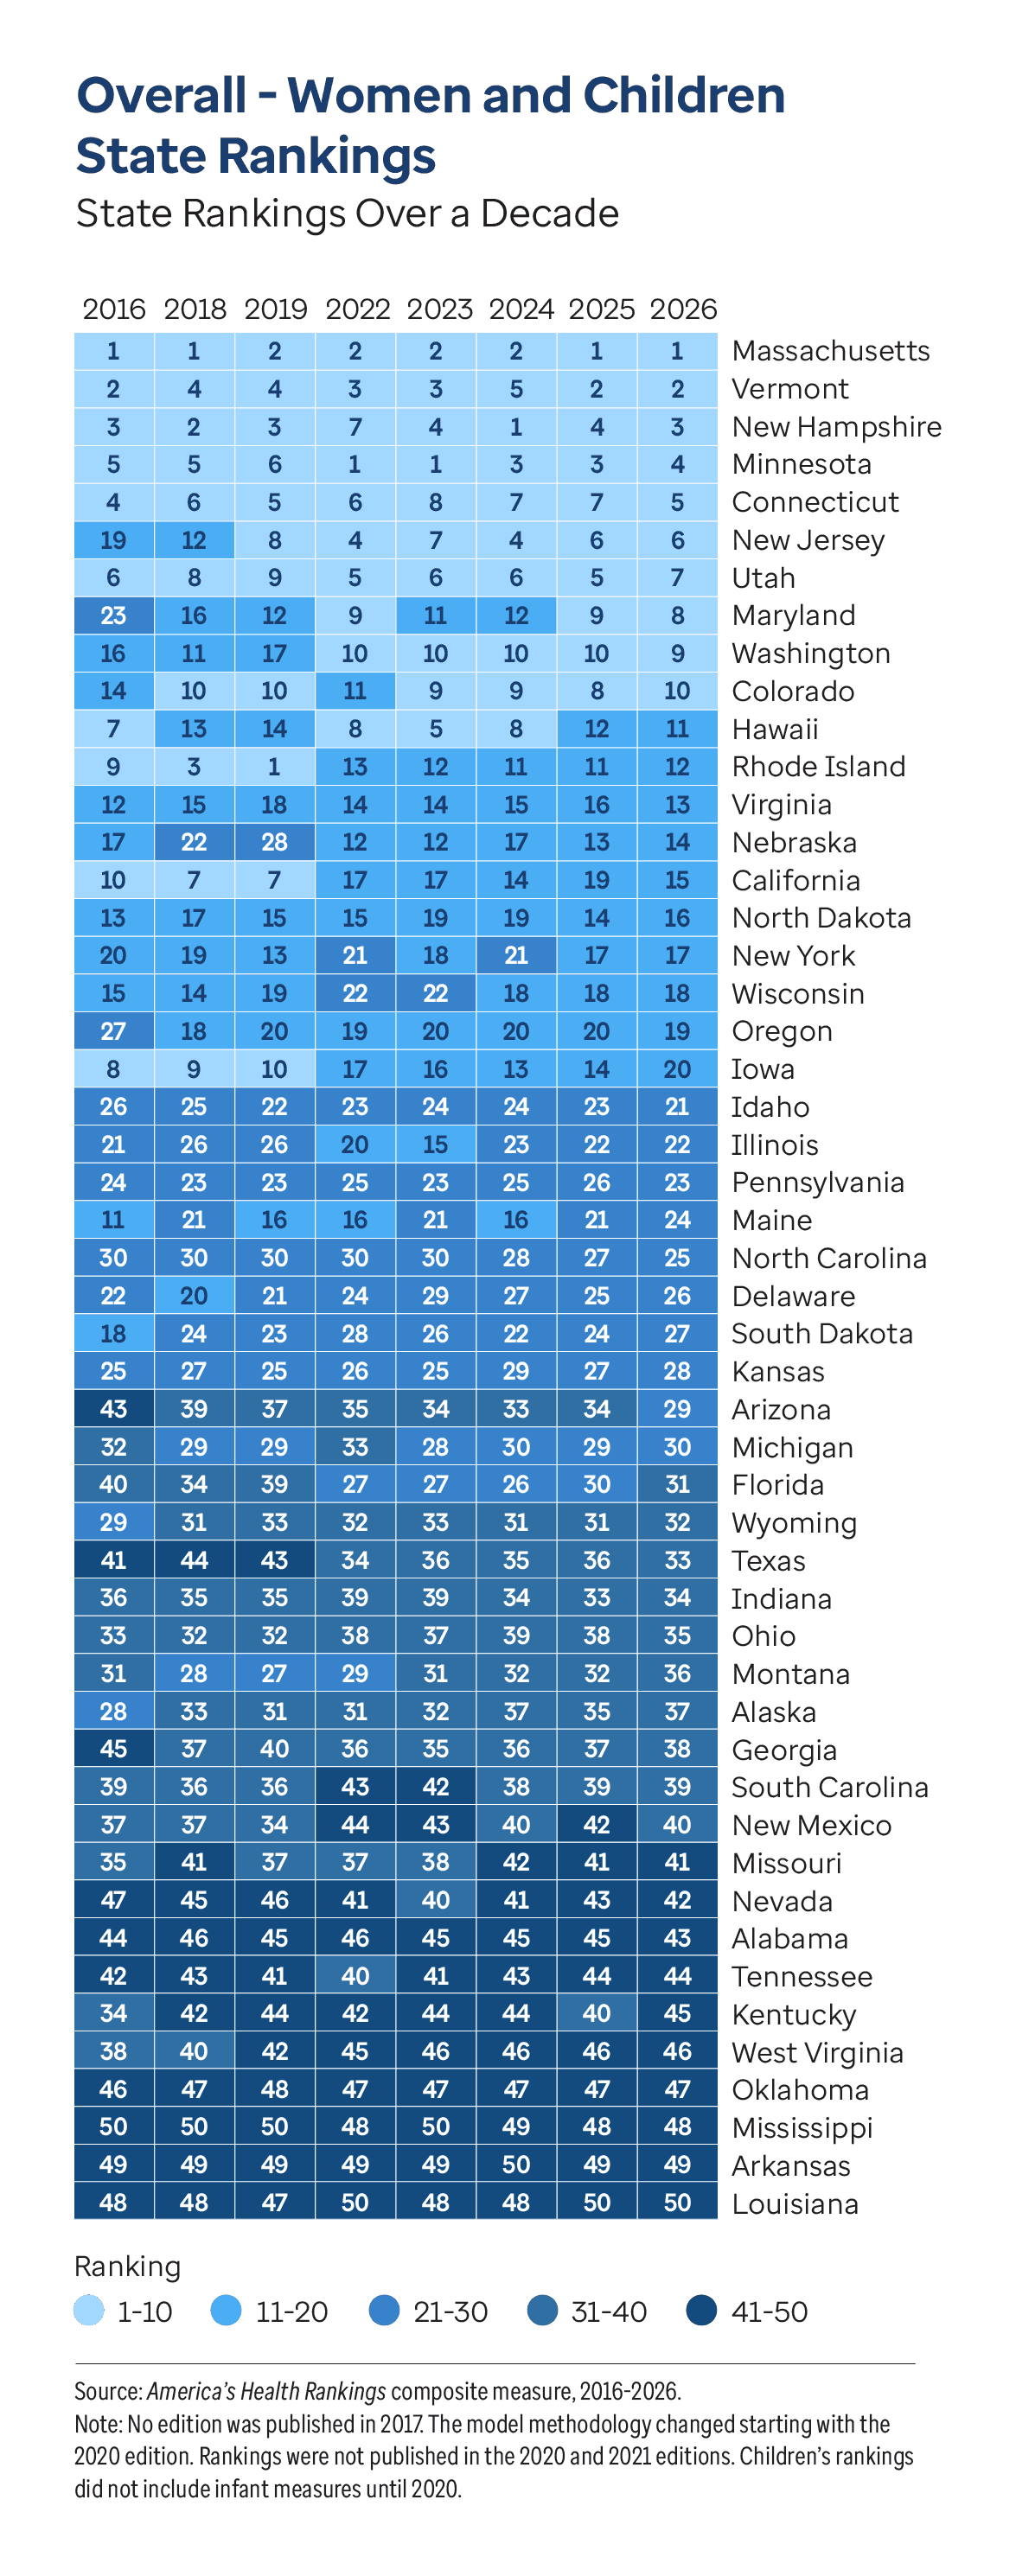
State Rankings Over a Decade
Since the publication of the first
America’s Health Rankings Health of Women and Children Report in 2016, Massachusetts, Vermont, New Hampshire, Minnesota and Connecticut have consistently remained in the top 10 healthiest states, while Louisiana, Arkansas, Mississippi and Oklahoma have consistently ranked among the 10 least healthy states.
Three states improved more than 10 places between 2016 and 2026:
- Maryland’s rank improved 15 places (No. 23 to No. 8).
- Arizona’s rank improved 14 places (No. 43 to No. 29).
- New Jersey’s rank improved 13 places (No. 19 to No. 6).
Eight additional states improved in rank by at least five places:
- Florida (No. 40 to No. 31) improved nine places.
- Oregon (No. 27 to No. 19) and Texas (No. 41 to No. 33) improved eight places.
- Washington (No. 16 to No. 9) and Georgia (No. 45 to No. 38) improved seven places.
- Idaho (No. 26 to No. 21), North Carolina (No. 30 to No. 25) and Nevada (No. 47 to No. 42) improved five places.
On the other hand, three states worsened 10 or more places between 2016 and 2026:
- Maine’s rank declined 13 places (No. 11 to No. 24).
- Iowa’s rank declined 12 places (No. 8 to No. 20).
- Kentucky’s rank declined 11 places (No. 34 to No. 45).
The ranks of six additional states worsened five or more places between 2016 and 2026:
- Alaska (No. 28 to No. 37) and South Dakota (No. 18 to No. 27) declined nine places.
- West Virginia (No. 38 to No. 46) declined eight places.
- Missouri (No. 35 to No. 41) declined six places.
- California (No. 10 to No. 15) and Montana (No. 31 to No. 36) declined five places.
Note: This report presents these long-term comparisons, noting that the underlying measures and methodologies have evolved over the last decade. The model methodology changed starting with the 2020 edition, rankings were not published in the 2020 and 2021 editions, and children's rankings did not include infant measures prior to 2020.

 US Summary
 Alabama
 Alaska
 Arizona
 Arkansas
 California
 Colorado
 Connecticut
 Delaware
 District of Columbia
 Florida
 Georgia
 Hawaii
 Idaho
Idaho Illinois
 Indiana
 Iowa
Iowa Kansas
 Kentucky
 Louisiana
 Maine
Maine Maryland
 Massachusetts
 Michigan
 Minnesota
 Mississippi
 Missouri
 Montana
 Nebraska
 Nevada
 New Hampshire
 New Jersey
 New Mexico
 New York
 North Carolina
 North Dakota
 Ohio
Ohio Oklahoma
 Oregon
 Pennsylvania
 Rhode Island
 South Carolina
 South Dakota
 Tennessee
 Texas
Texas Utah
Utah Vermont
 Virginia
 Washington
 West Virginia
 Wisconsin
 Wyoming