Community and Family Safety
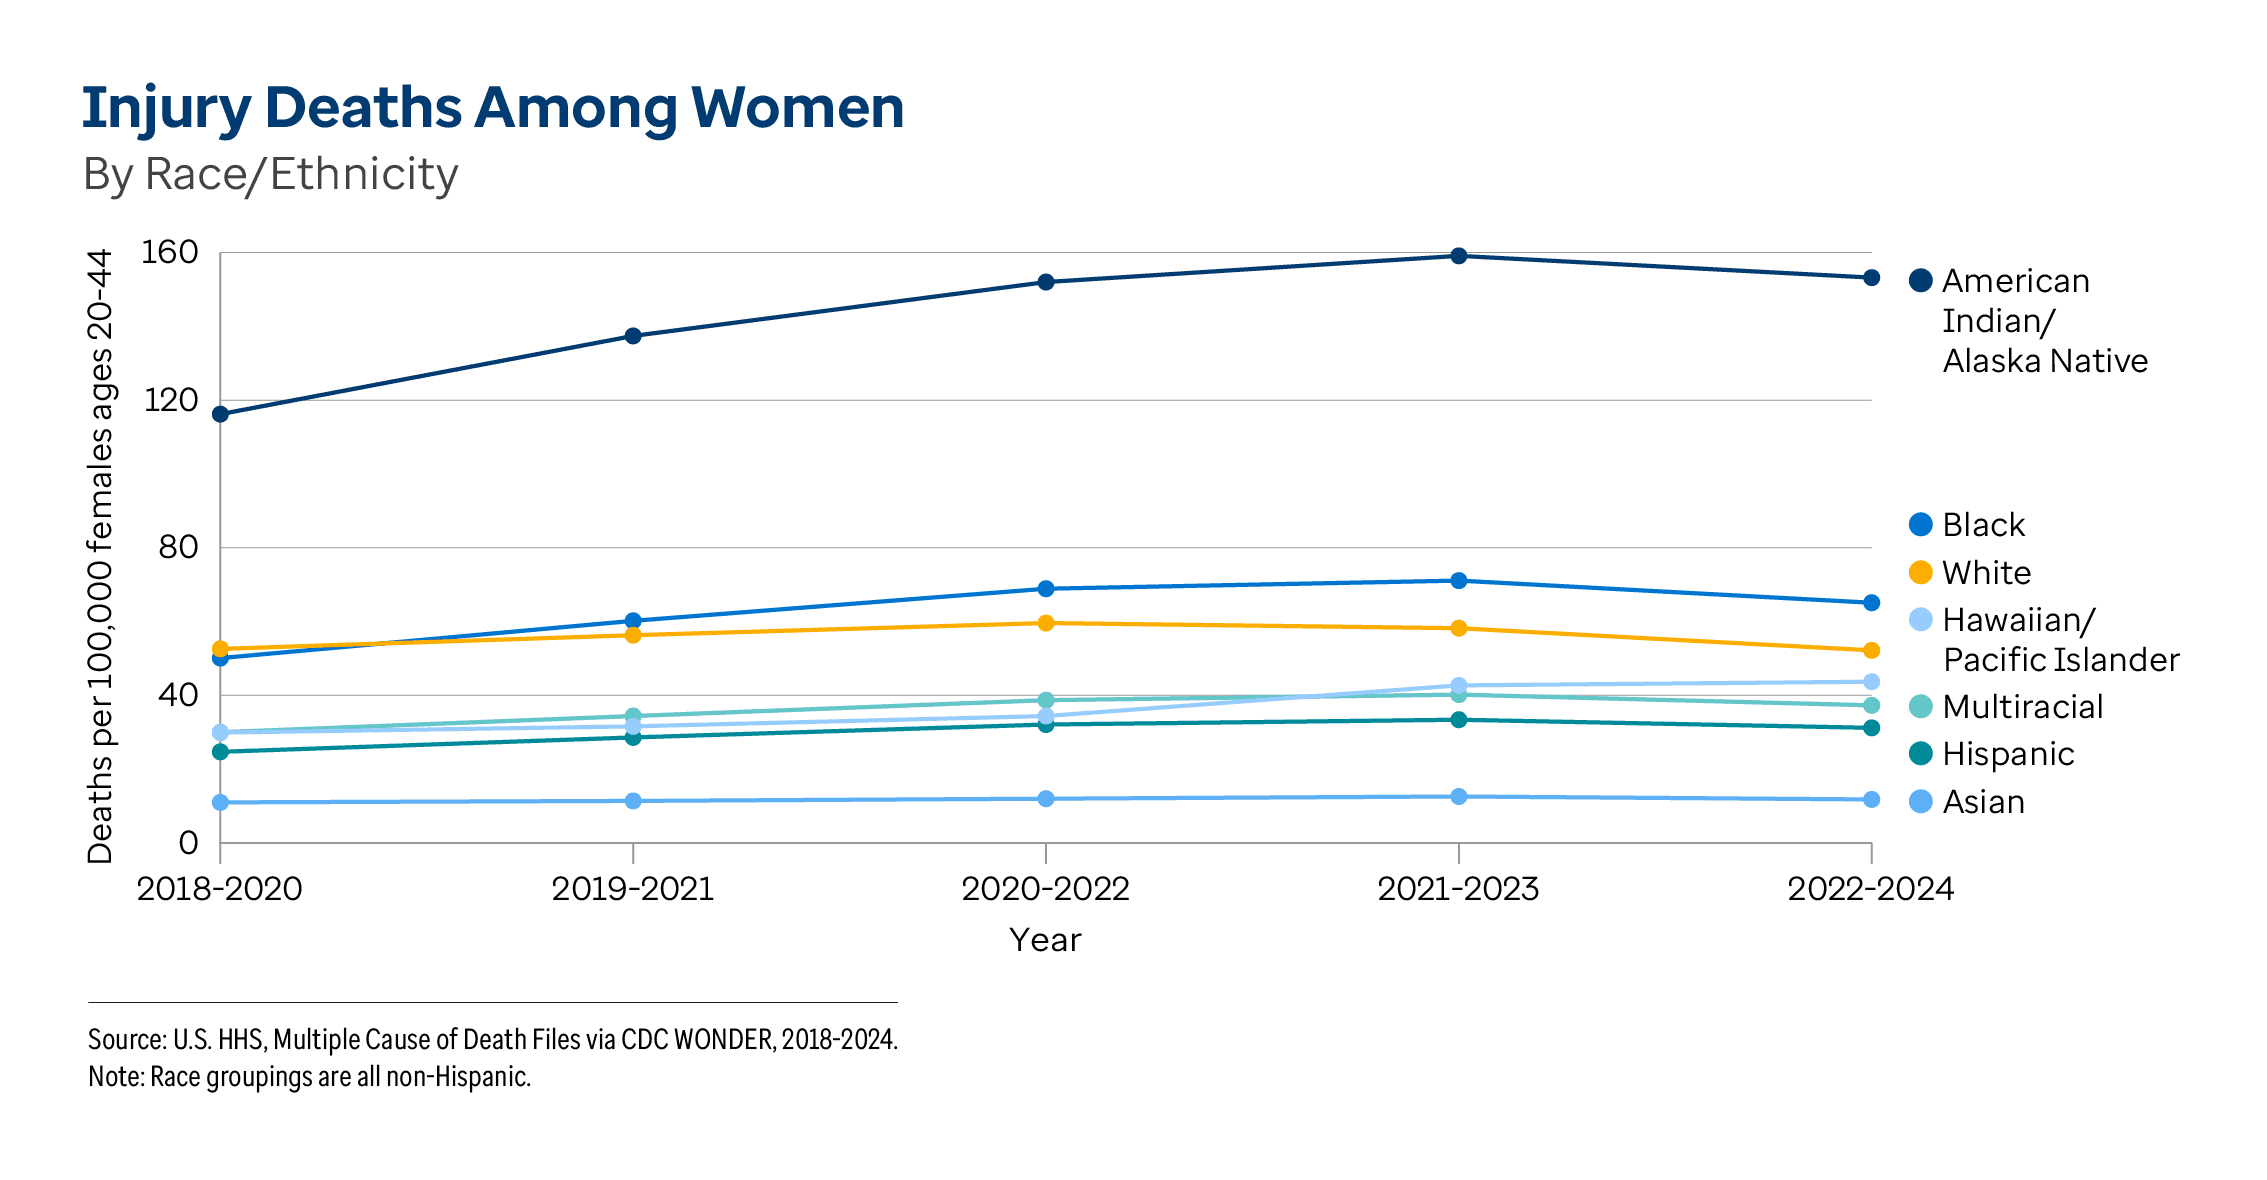
Injury Deaths Among Women
Changes over the last decade. Nationally, the
injury death rate — the number of deaths due to injury per 100,000 females ages 20-44 — increased 47%, from 31.9 to 47.0 between 2012-2014 and 2022-2024. In the most recent period of 2022-2024, the rate decreased 2% (from 48.1 in 2019-2021). In 2022-2024, there were approximately 78,300 injury deaths among women of reproductive age in the U.S., nearly 28,000 more deaths than in 2012-2014.
In the decade between 2012-2014 and 2022-2024, injury deaths among women significantly decreased in one state: 17% in
Utah (42.2 to 35.2 deaths per 100,000 females ages 20-44). During the same period, the rate significantly increased in 44 states and the District of Columbia. The largest increases were 106% in
Alaska (54.1 to 111.7), 103% in the
District of Columbia (17.8 to 36.1), 84% in
Maine (33.3 to 61.2) and 81% in both
Delaware (37.4 to 67.7) and
North Dakota (28.0 to 50.7).
Recent differences. The injury death rate significantly varied by race/ethnicity, geography and age. In 2022-2024, the rate among women ages 20-44 was:
Injury Deaths Among Children
Injury death, including accidents or unintentional injuries, homicide and suicide, has been the
leading cause of death among children ages 1-19 in the U.S. for the last decade, according to
America’s Health Rankings analysis of CDC data.
3 Unintentional motor vehicle accidents remained the
leading cause of injury death for children ages 1-19 from 2014 to 2024, followed by homicide by firearm.
3 Other prevalent causes of injury death throughout the decade include suicide and unintentional drowning.
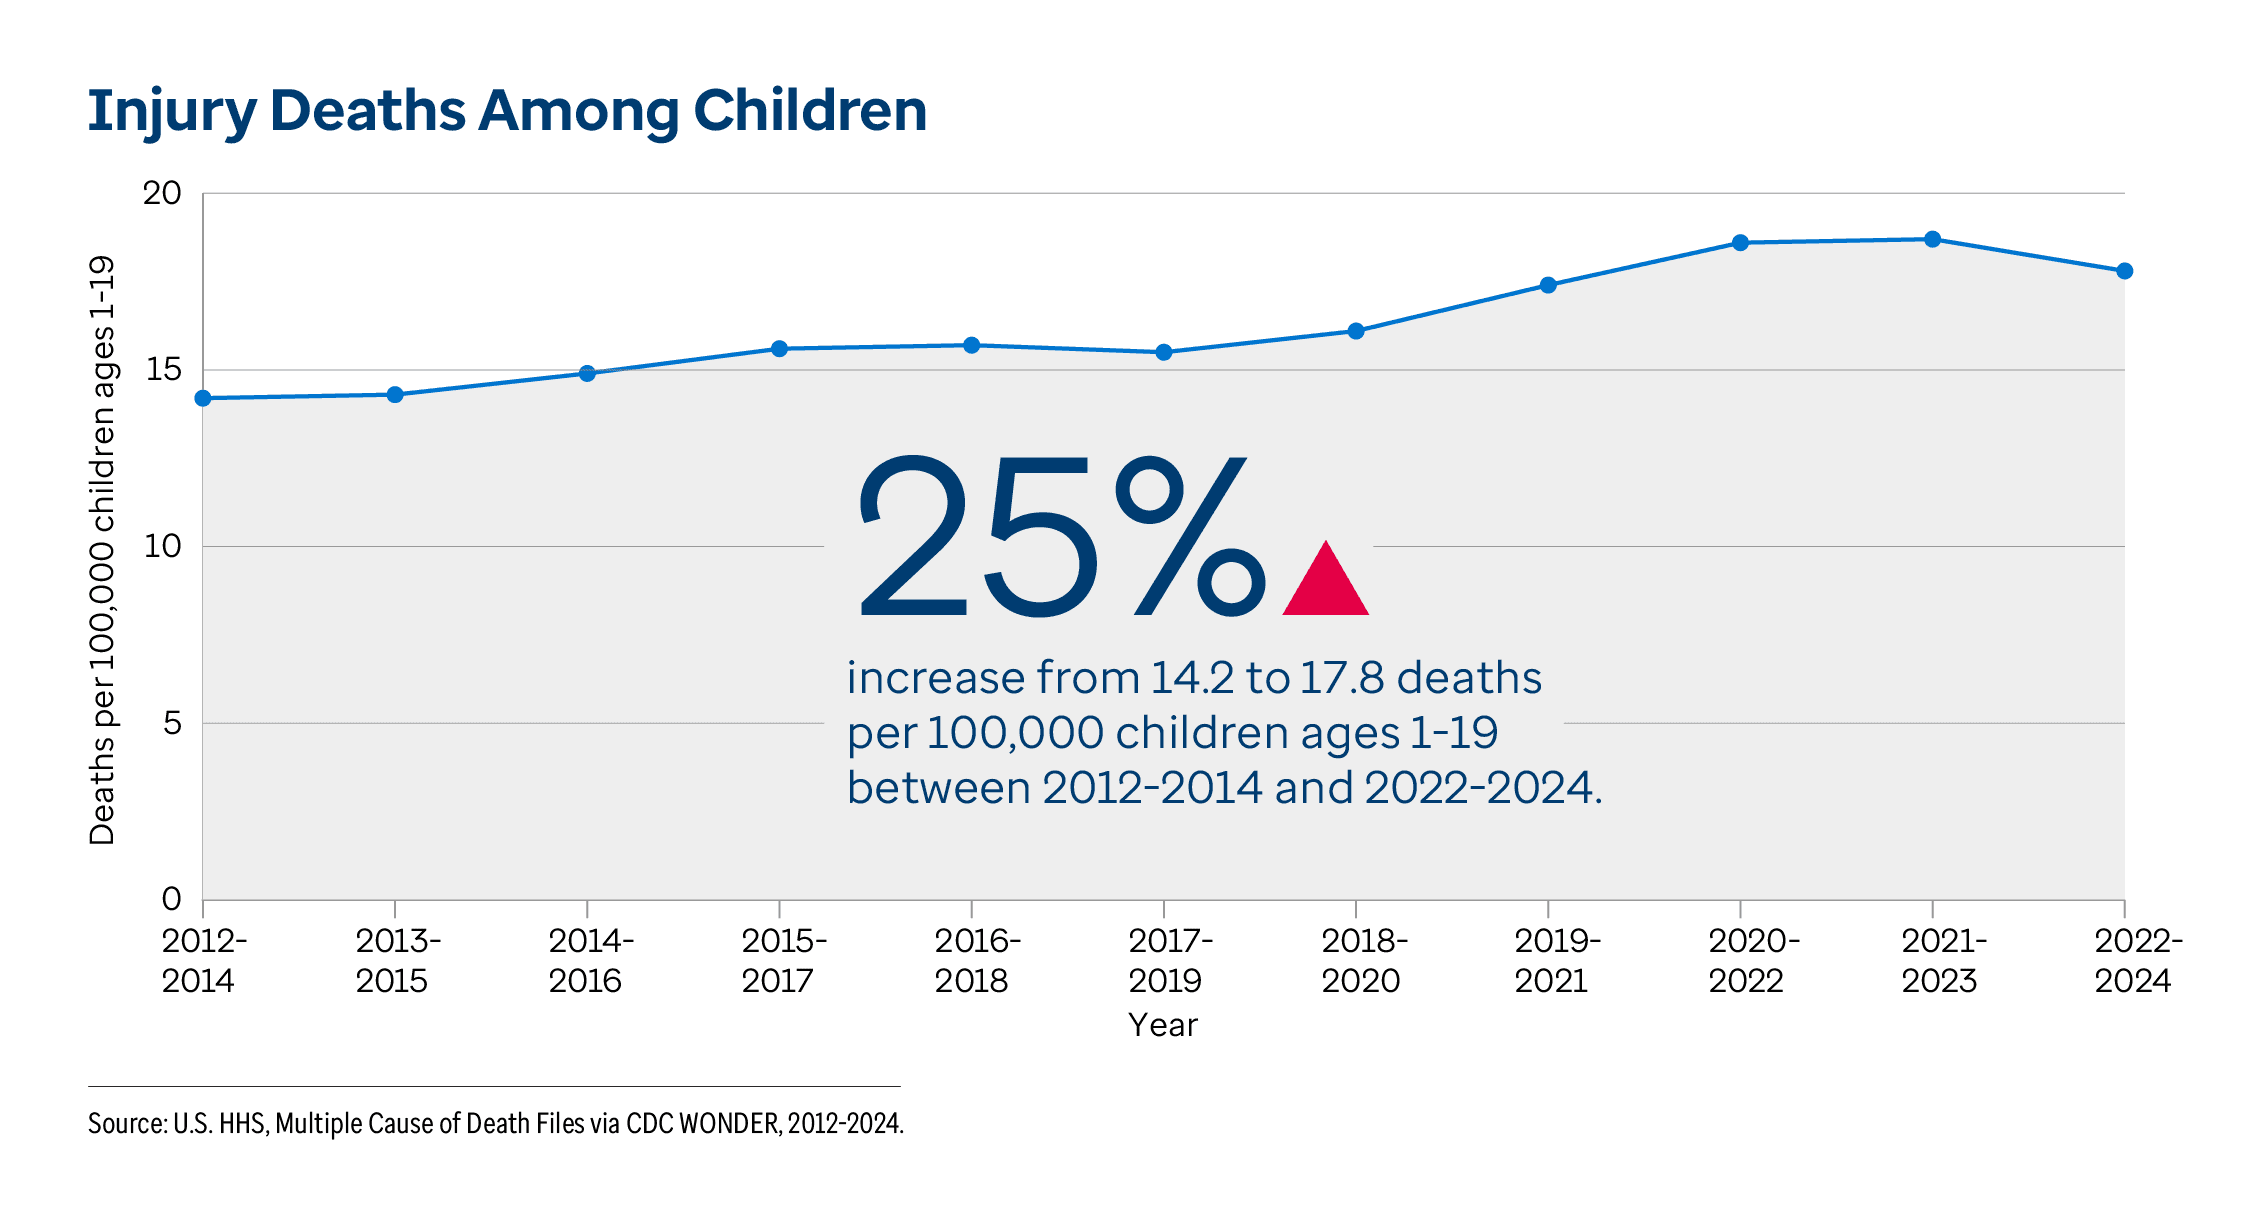
Changes over the last decade. Nationally, the
injury death rate — the number of deaths due to injury per 100,000 children ages 1-19 — increased 25% from 14.2 to 17.8 between 2012-2014 and 2022-2024. In 2022-2024, there were approximately 41,600 injury deaths among children in the U.S., nearly 8,200 more deaths than in 2012-2014.
In the decade between 2012-2014 and 2022-2024, injury deaths among children significantly increased in 26 states and the District of Columbia. The largest increases were 134% in the
District of Columbia (14.1 to 33.0 deaths per 100,000 children ages 1-19), 53% in
New Mexico (20.0 to 30.6), 49% in
Tennessee (17.4 to 26.0) and 48% in both
Mississippi (23.6 to 34.9) and
Colorado (14.9 to 22.0).
Recent differences. The injury death rate significantly varied by age, race/ethnicity, geography and gender. In 2022-2024, the rate was:
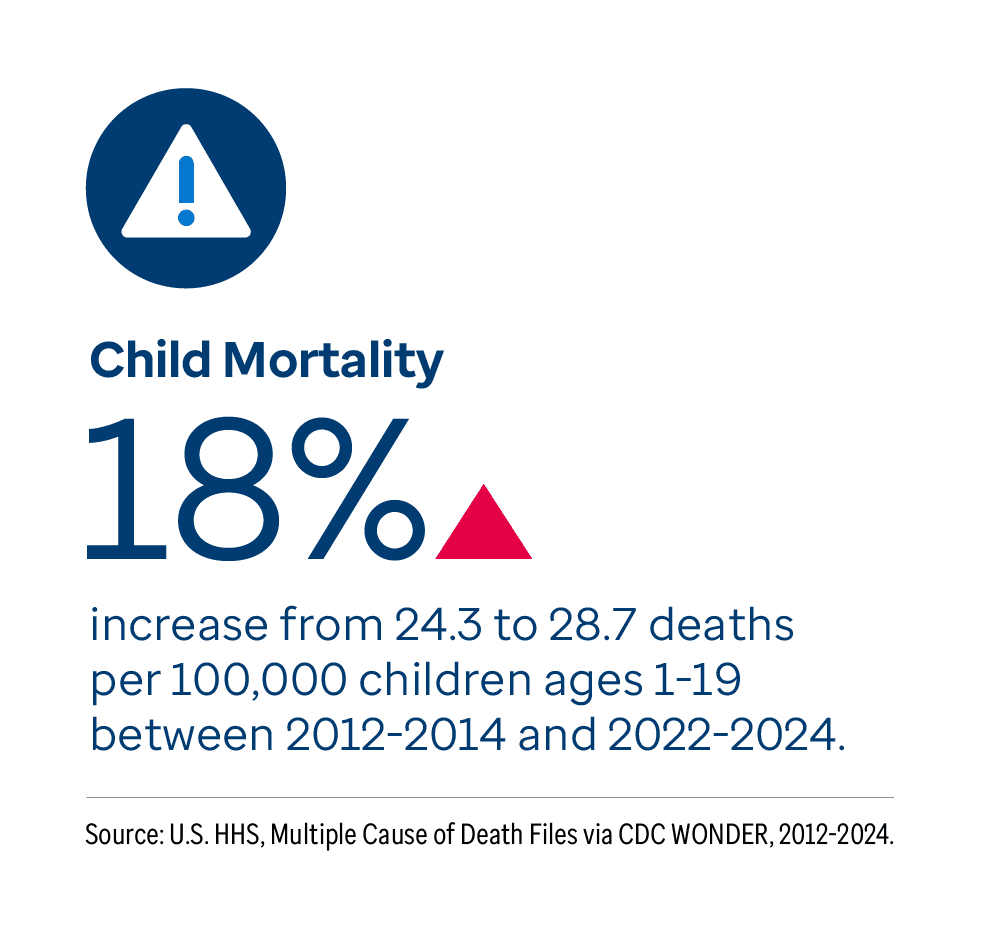
Nationally, the
child mortality rate — the number of deaths per 100,000 children ages 1-19 — increased 18% from 24.3 to 28.7 deaths per 100,000 children ages 1-19 between 2012-2014 and 2022-2024. The current rate exceeds the
Healthy People 2030 target of 18.4 deaths among children and adolescents ages 1-19 per 100,000 population.
33 In 2022-2024, 67,000 children died, 10,000 more deaths than in 2012-2014. In the decade between 2012-2014 and 2022-2024, the child mortality rate significantly increased in 27 states and the District of Columbia. The largest increases were 67% in the
District of Columbia (26.3 to 43.8 deaths per 100,000 children ages 1-19), 36% in both
North Carolina (25.8 to 35.1) and
Mississippi (36.7 to 49.9), and 33% in
New Mexico (30.8 to 41.1). In 2022-2024, the child mortality rate was 3.0 times higher in Mississippi (49.9) than in
Massachusetts (16.6). The child mortality rate also significantly varied by race/ethnicity, age and gender. For more information, view
child mortality data.
Firearm Deaths Among Children
Nationally, the
firearm death rate — the number of deaths among children ages 1-19 due to firearm injury of any intent (unintentional, suicide, homicide or undetermined) per 100,000 population — increased 67% from 3.3 to 5.5 between 2012-2014 and 2022-2024. In 2022-2024, nearly 13,000 children died due to firearm injury, 5,000 more than in 2012-2014.
During the same time period, the firearm death rate significantly increased in 26 states and the District of Columbia. The largest increases were 267% in the
District of Columbia (5.8 to 21.3 deaths per 100,000 children ages 1-19), 198% in
Mississippi (4.9 to 14.6), 189% in
New Mexico (3.8 to 11.0) and 147% in
Georgia (3.6 to 8.9). In 2022-2024, the firearm death rate among children ages 1-19 was 14.2 times higher in the District of Columbia (21.3) and 9.7 times higher in Mississippi (14.6) than in
Massachusetts (1.5). The firearm death rate also significantly varied by age and race/ethnicity. For more information, view
child firearm deaths data.
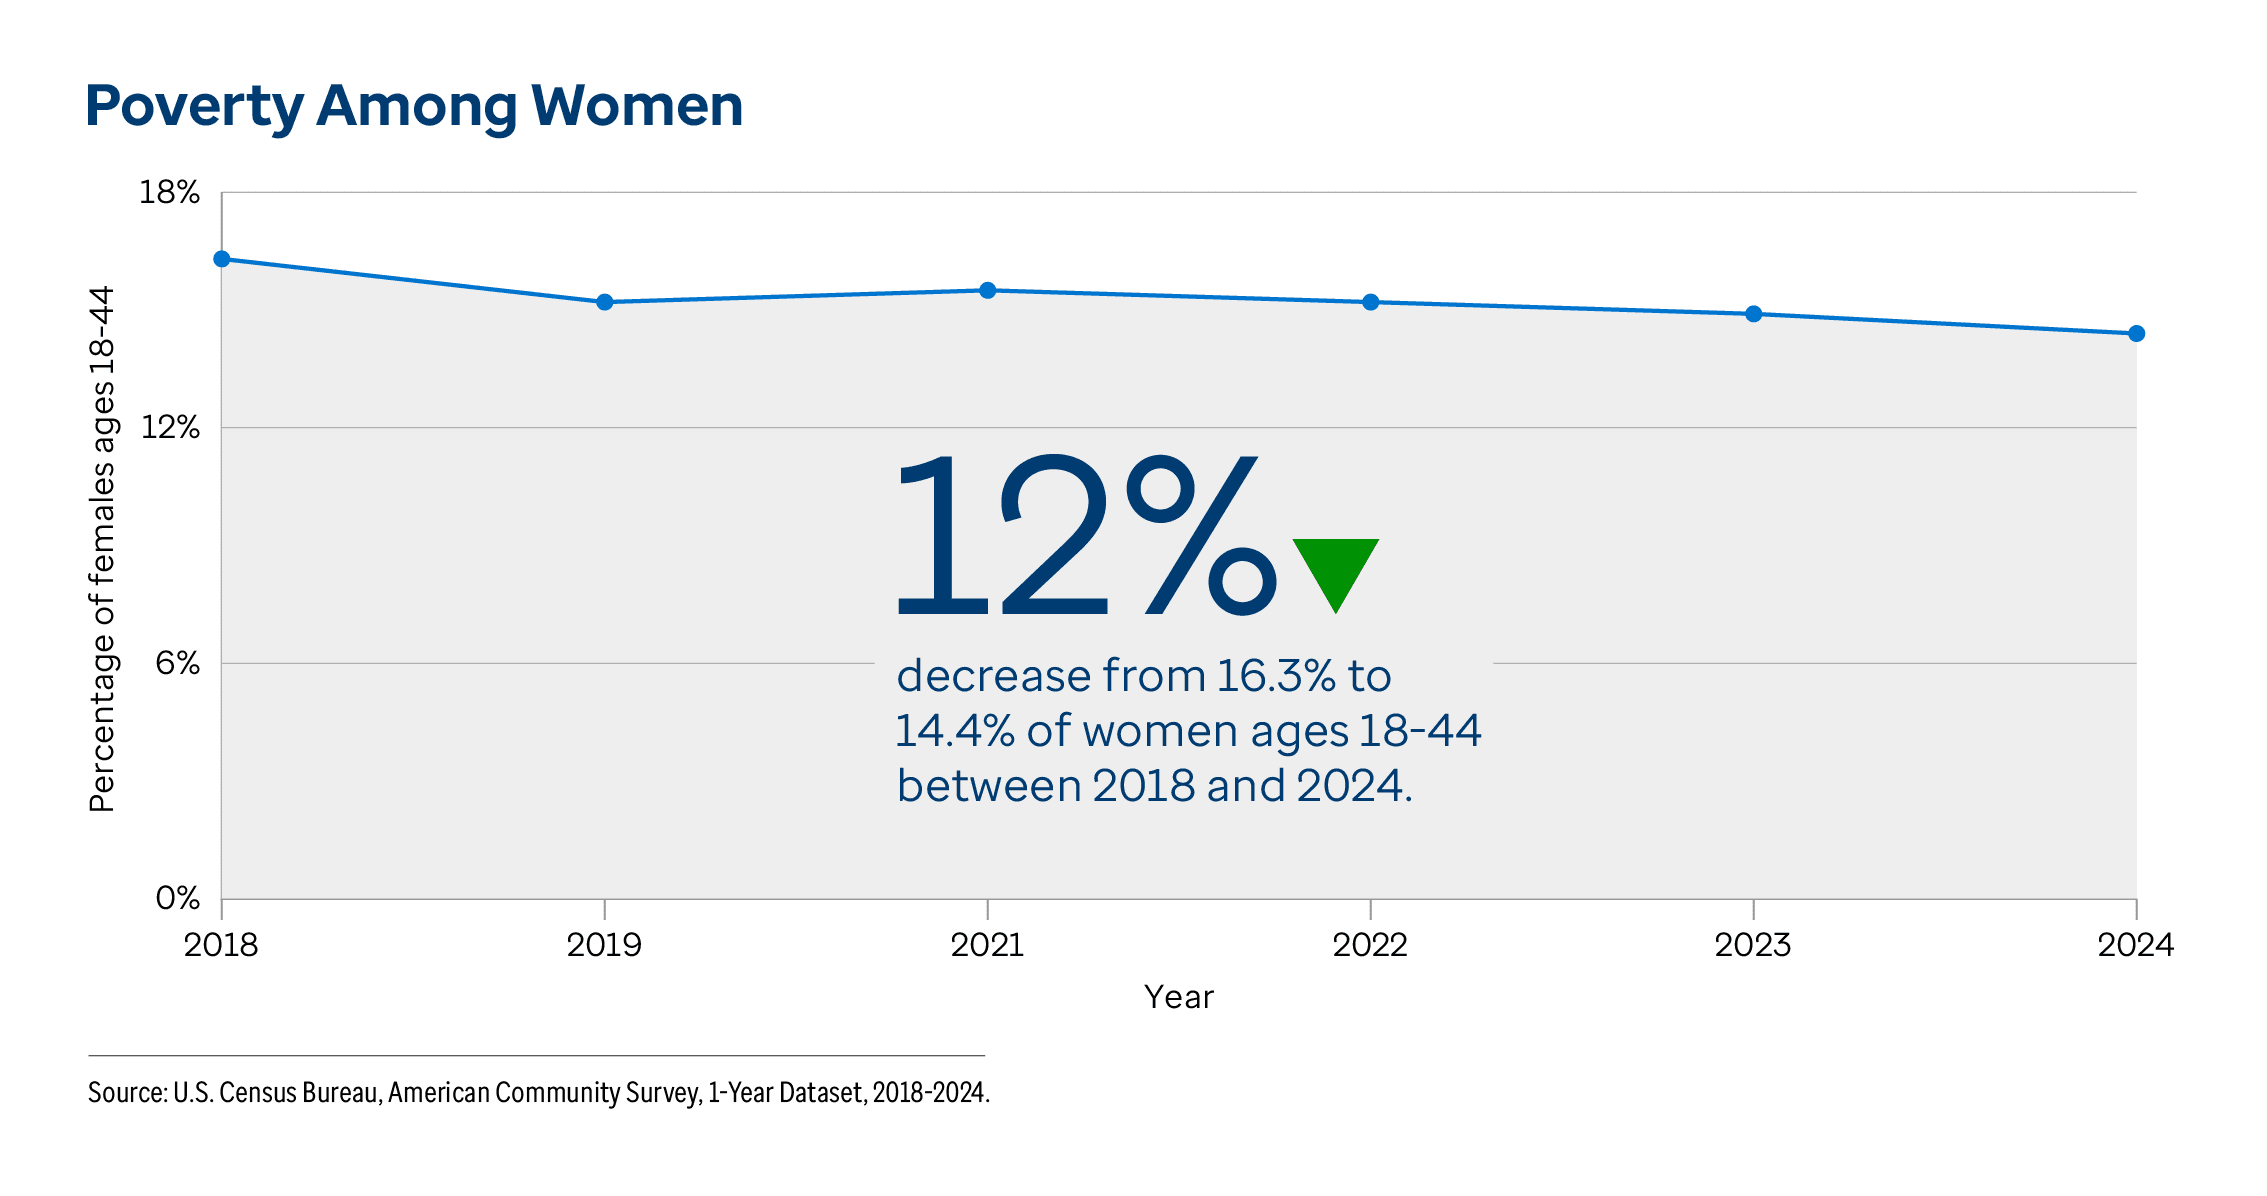
Poverty is associated with many
adverse health outcomes.
34 Women with household incomes below the federal poverty level frequently face barriers to affording
essential needs such as stable housing, health insurance and food.
35 Between 2018 and 2024, the poverty rate significantly decreased in 24 states. The largest decreases were 34% in
Montana (17.1% to 11.3%), 26% in
New Mexico (23.9% to 17.6%) and 20% in
Arizona (16.8% to 13.4%).
Recent differences. The poverty rate significantly varied by geography and race/ethnicity. In 2024, the prevalence among women ages 18-44 was:
Note: Differences highlight the groups with the highest and lowest values. However, the values for certain race/ethnicity groups may not differ significantly based on overlapping 95% confidence intervals. For more information, view
poverty data for women.
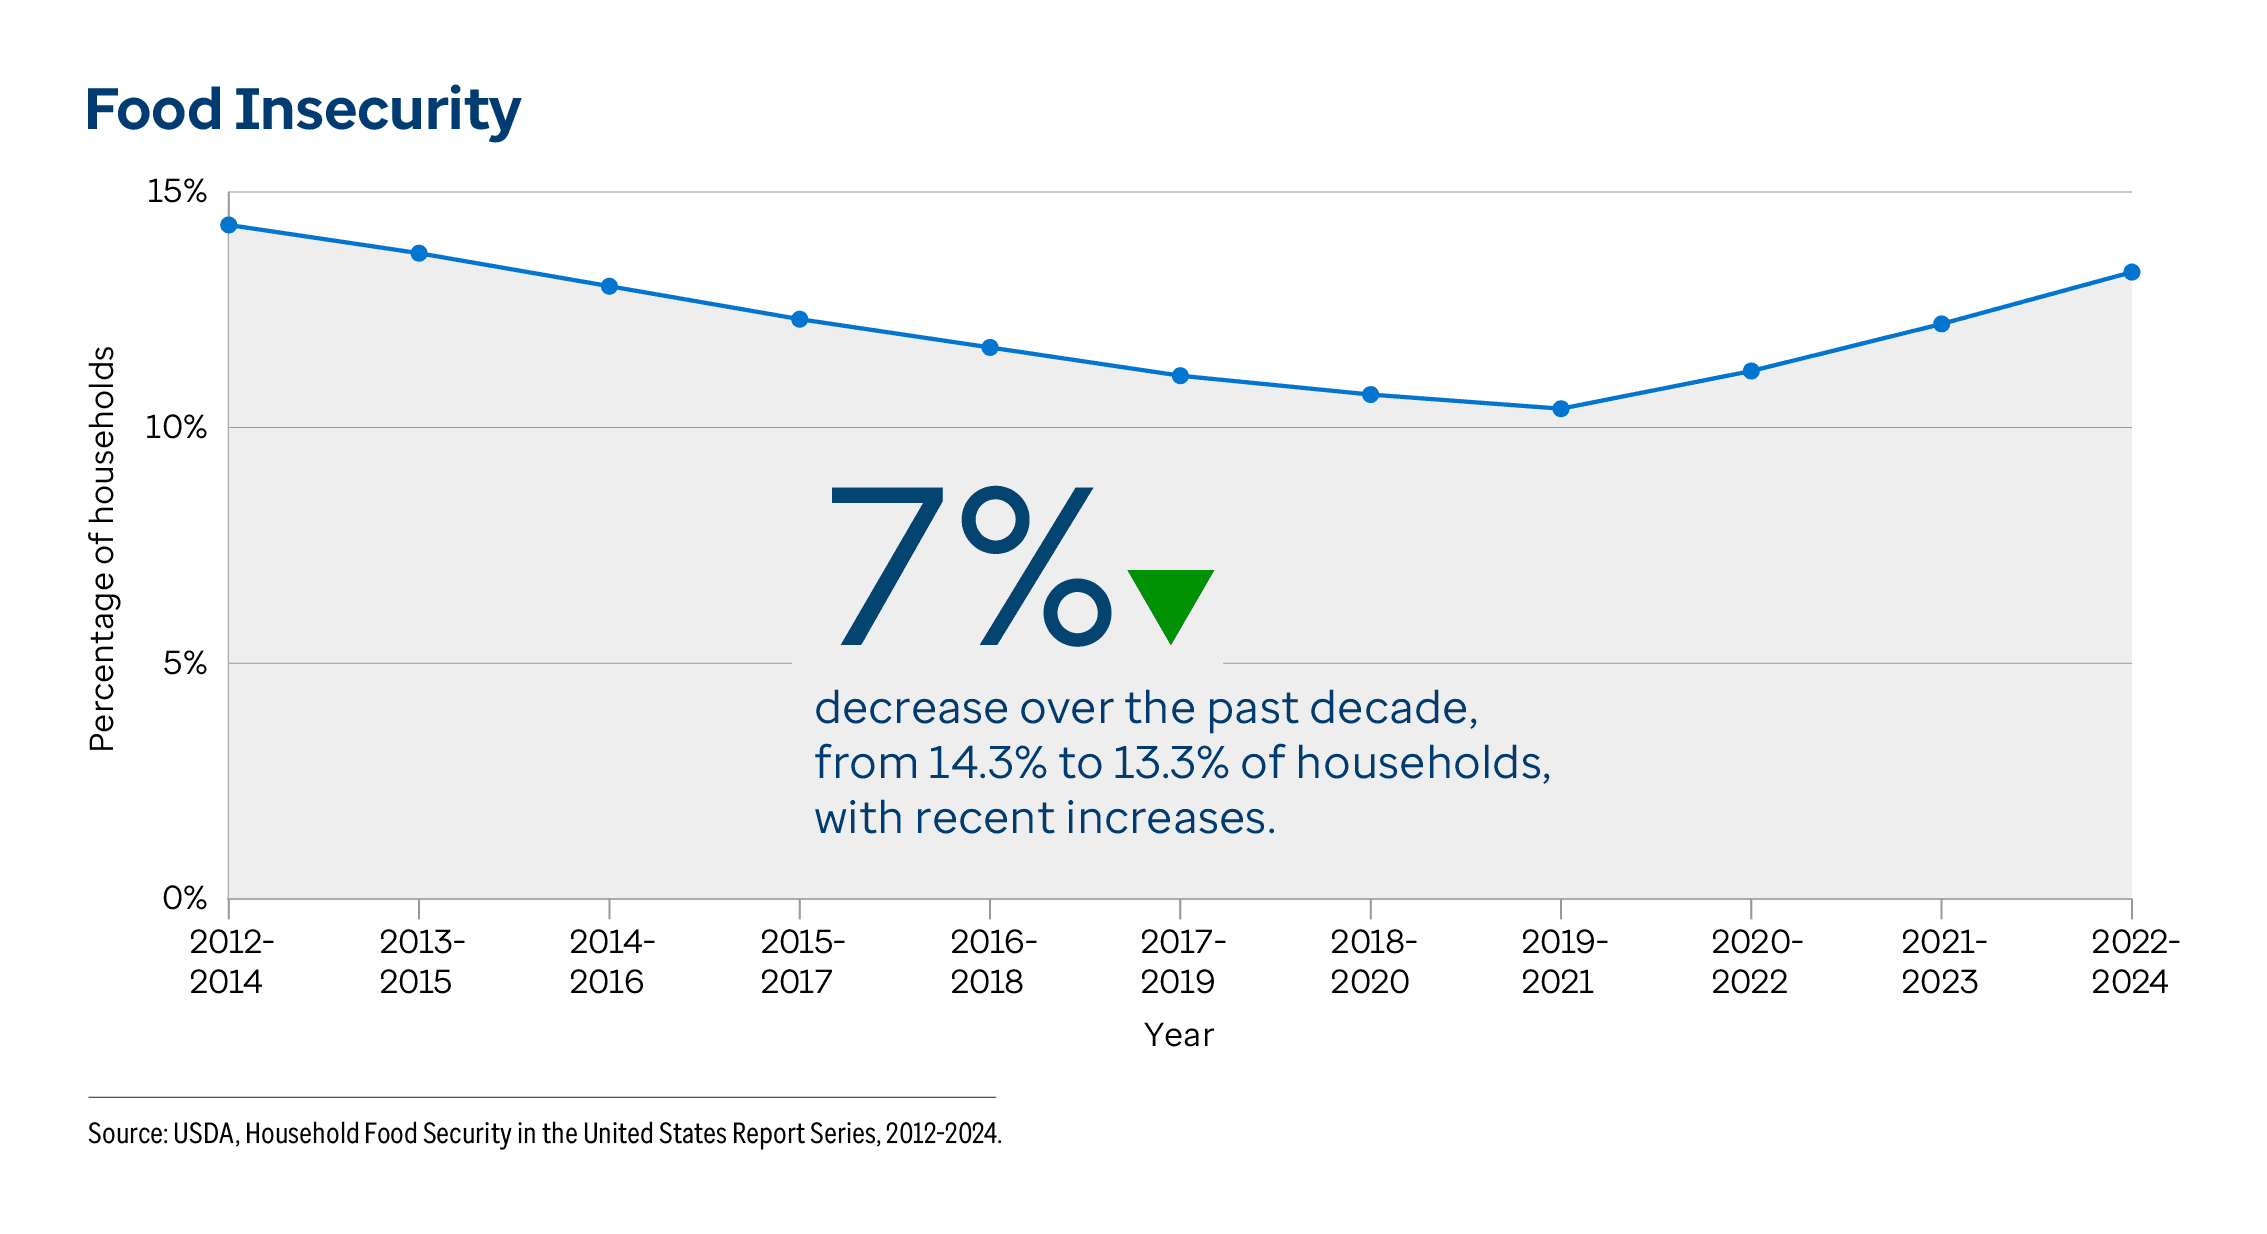
In the decade between 2012-2014 and 2022-2024, the prevalence of food insecurity decreased in two states: 29% in
North Carolina (16.7% to 11.8% of households) and 21% in
Mississippi (22.0% to 17.3%). In 2022-2024, the prevalence of food-insecure households was 2.2 times higher in
Arkansas (19.4%) than in
North Dakota (9.0%).
“When health care providers, schools, families and communities reinforce one another, guidance can become action, and consistent healthy behaviors can become part of children’s everyday lives and help them thrive as they grow up.”
– Traci Causey, PhD, MBA, MCHES CEO of the Alliance for a Healthier Generation
Changes over the last decade. Nationally, the rate of
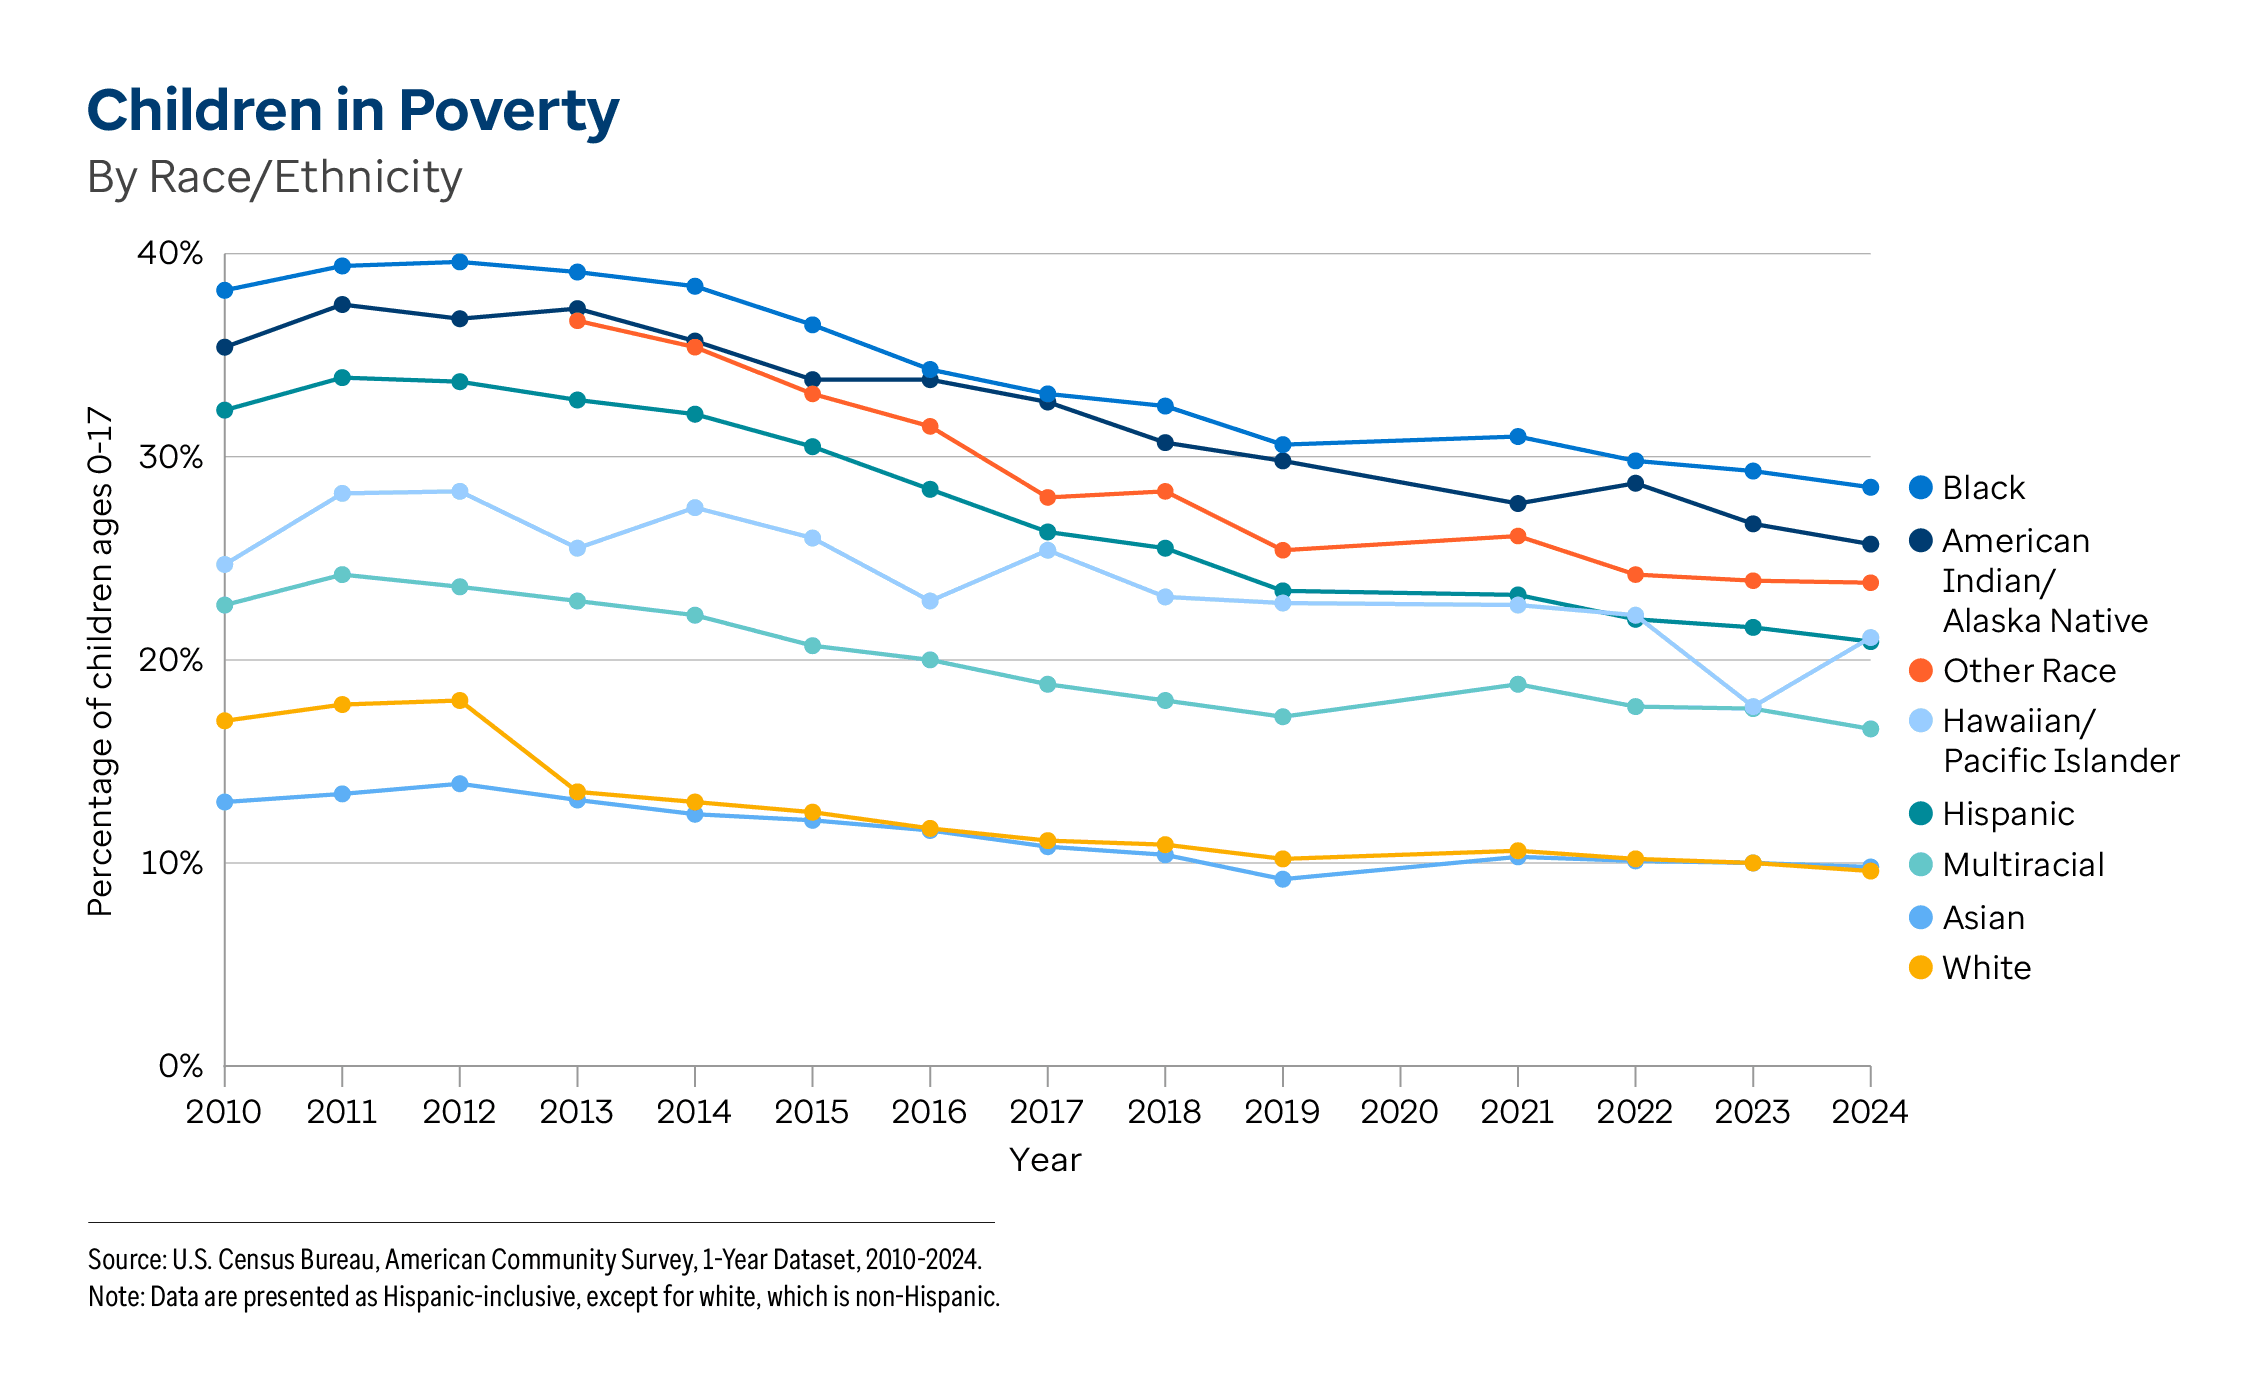
children in poverty — the percentage of children ages 0-17 living in households below the poverty threshold — decreased 29% from 21.7% to 15.5% between 2014 and 2024. The prevalence of children in poverty peaked in 2012 at 22.6%, followed by a 31% decrease between 2012 and 2024.
During the same time period, the rate of children in poverty decreased in 43 states. The largest decreases were 49% in
New Hampshire (13.0% to 6.6%), 43% in
Arizona (25.6% to 14.6%) and 42% in
Vermont (15.8% to 9.1%).
Recent differences. The children in poverty rate significantly varied by geography and race/ethnicity. In 2024, the prevalence among children was:
- 4.3 times higher in the District of Columbia (28.3%) and 3.8 times higher in Louisiana and Mississippi (both 25.2%) than in New Hampshire (6.6%).
- 3.0 times higher among Black (28.5%) compared with white (9.6%) children.
Note: Differences highlight the groups with the highest and lowest values. However, the values for certain race/ethnicity groups may not differ significantly based on overlapping 95% confidence intervals. For more information, view
poverty data for children.
Children in Poverty Racial Disparity
Nationally, the
racial disparity among children in poverty — the ratio of the childhood poverty rate of the racial/ethnic group with the highest rate (varies by state) to the non-Hispanic white rate — did not change between 2015-2019 (33.2% of Black children versus 11.1% of white children) and 2022-2024 (29.9% of
Black children versus 9.9% of
white children) and remains 3.0.
Nationally,
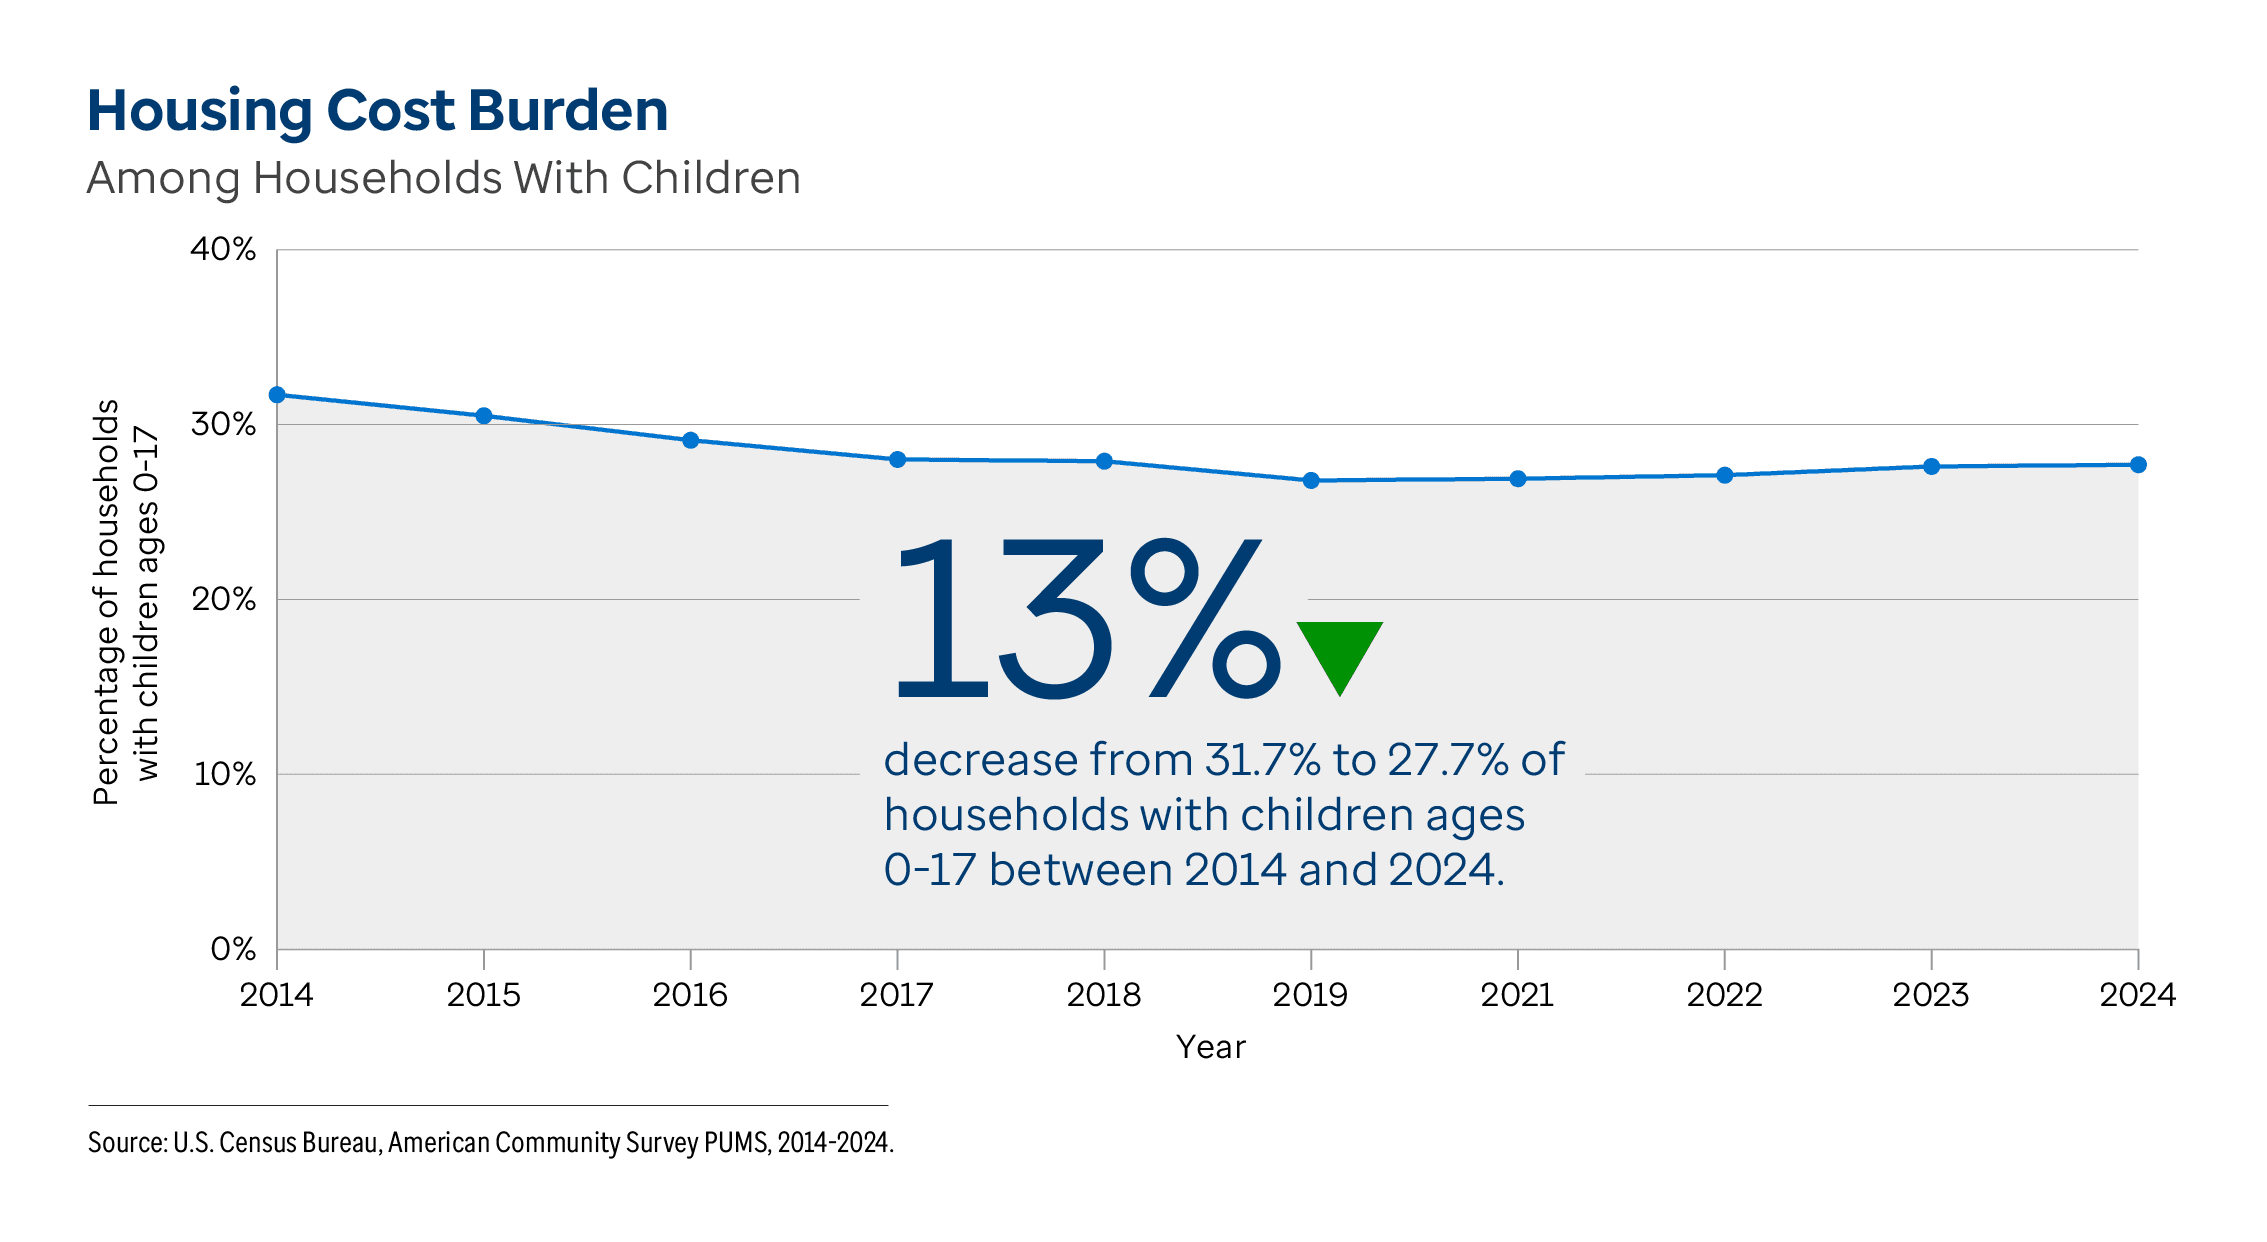
housing cost burden — the percentage of households with one or more children ages 0-17 with housing costs more than 30% of household income — decreased 13% from 31.7% to 27.7% in the 10 years between 2014 and 2024. However, the percentage of cost burdened households with children increased 3% since 2019 (from 26.8%). In 2024, nearly 10.0 million households with children were cost burdened, a decrease of over 1.2 million households compared with 2014.
In the decade between 2014 and 2024, housing cost burden decreased in 29 states. The largest decreases were 39% in
Maine (32.9% of households with children ages 0-17 to 20.1%), 39% in
Vermont (30.8% to 18.8%) and 27% in
Wisconsin (27.4% to 20.0%). In 2024, housing cost burden was 2.2 times higher in
Hawaii (38.8%) than in
West Virginia (18.0%).
College Graduation Among Women
Income differences between those with a college degree and those with only a high school diploma in the U.S. have remained prevalent for decades,
persisting into 2025.
41 Women with a bachelor’s degree earn a median of
$2.4 million over their lifetime compared with $1.3 million for high school graduates.
42 Changes over time. Nationally, the rate of
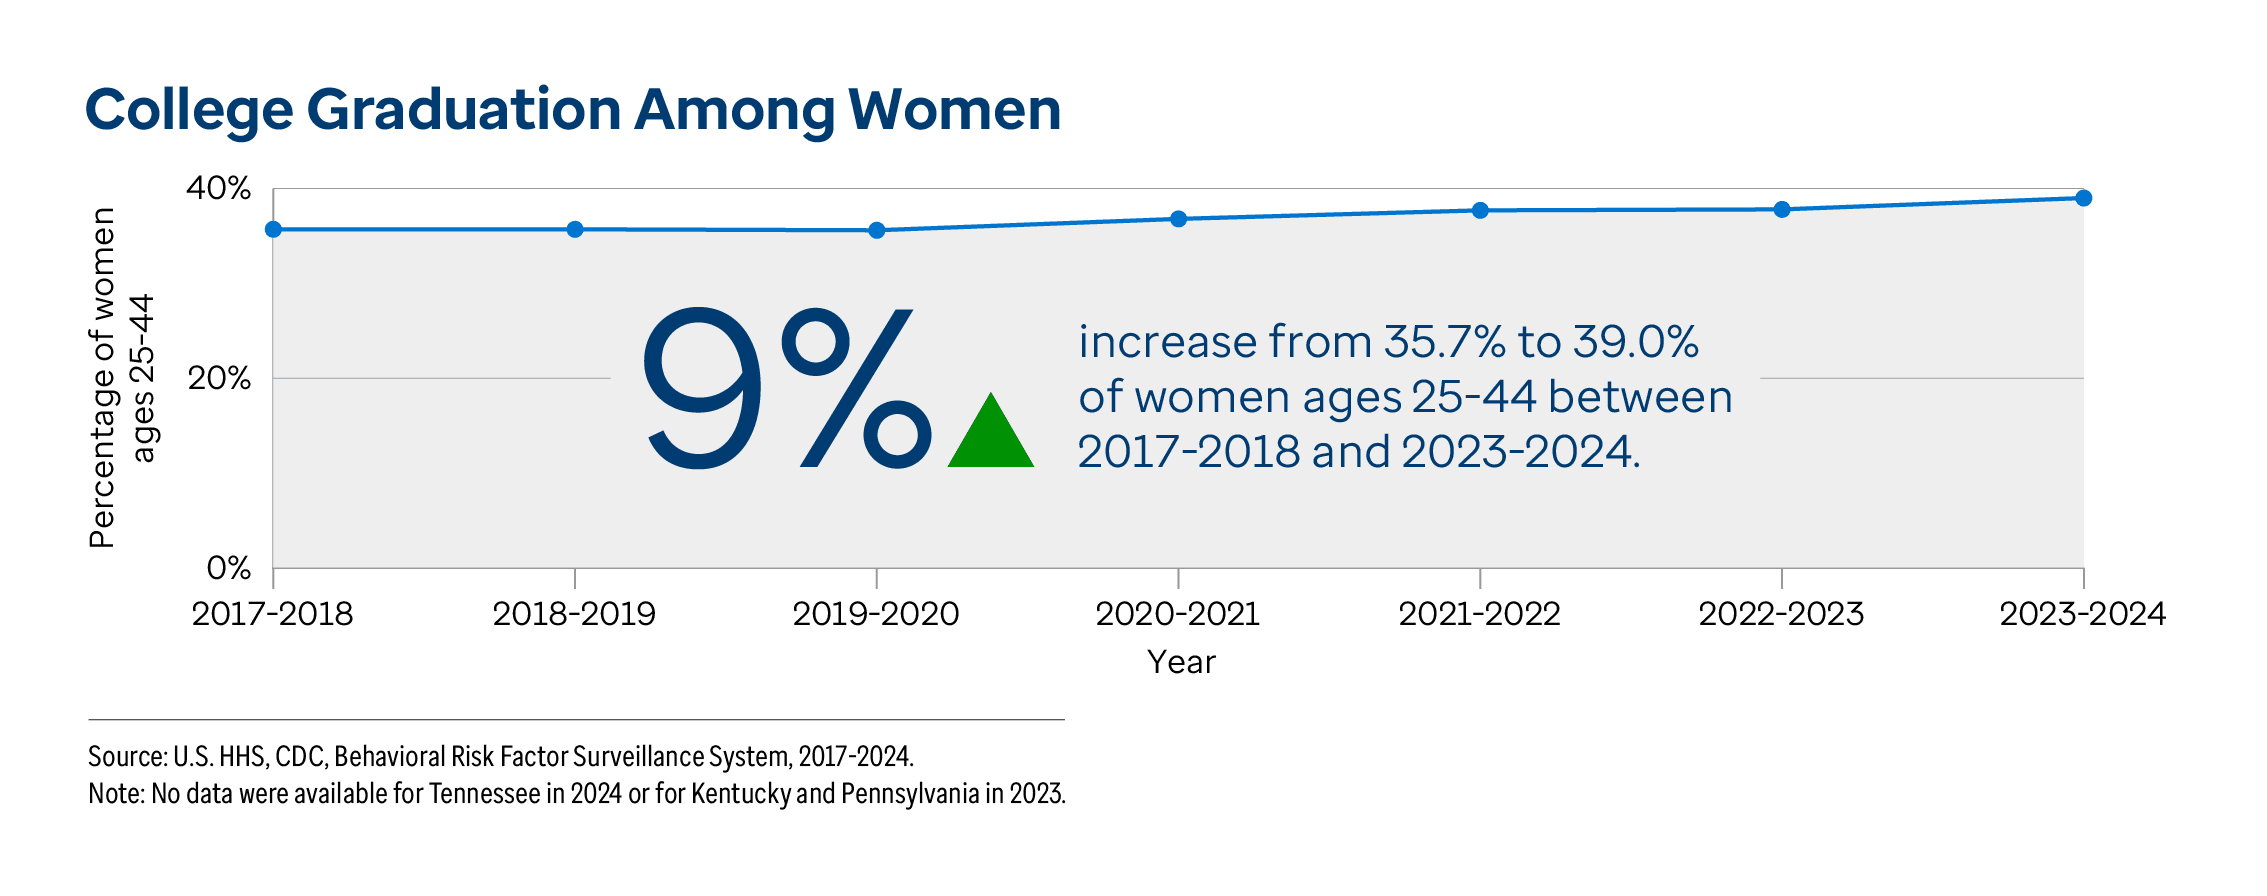
college graduates — the percentage of women ages 25-44 who have graduated from a college or technical school — increased 9% from 35.7% to 39.0% between 2017-2018 and 2023-2024. In 2023-2024, 16.6 million women were college graduates, an increase of nearly 1.5 million women compared with 2017-2018.
Between 2017-2018 and 2023-2024, women college graduates ages 25-44 significantly increased:
- 26% among Hispanic (16.9% to 21.3%), 15% among Black (29.1% to 33.4%) and 9% among white (41.5% to 45.4%) women.
- 10% among women ages 25-34 (33.9% to 37.2%) and 8% among women ages 35-44 (37.6% to 40.6%).
During the same time period, the rate of women college graduates significantly decreased 20% among those with an annual household income of
$25,000 to $49,999 (24.6% to 19.7%) and 9% among those with an income of
$50,000 to $74,999 (43.3% to 39.4%).
Between 2017-2018 and 2023-2024, the rate of women college graduates ages 25-44 increased in 12 states and the District of Columbia. The largest increases were 30% in
Idaho (27.2% to 35.4%), 23% in
Arizona (28.3% to 34.8%) and 22% in both
New Hampshire (37.8% to 46.1%) and the
District of Columbia (61.3% to 75.0%).
Recent differences. The rate of women college graduates significantly varied by income, race/ethnicity, disability status, geography, metropolitan status, age and sexual orientation. In 2023-2024, the percentage among women ages 25-44 was:
Note: No data were available for Tennessee in 2024 or for Kentucky and Pennsylvania in 2023. Differences highlight the groups with the highest and lowest values. However, the values for certain disability and race/ethnicity groups may not differ significantly based on overlapping 95% confidence intervals. For more information, view
college graduate data for women.
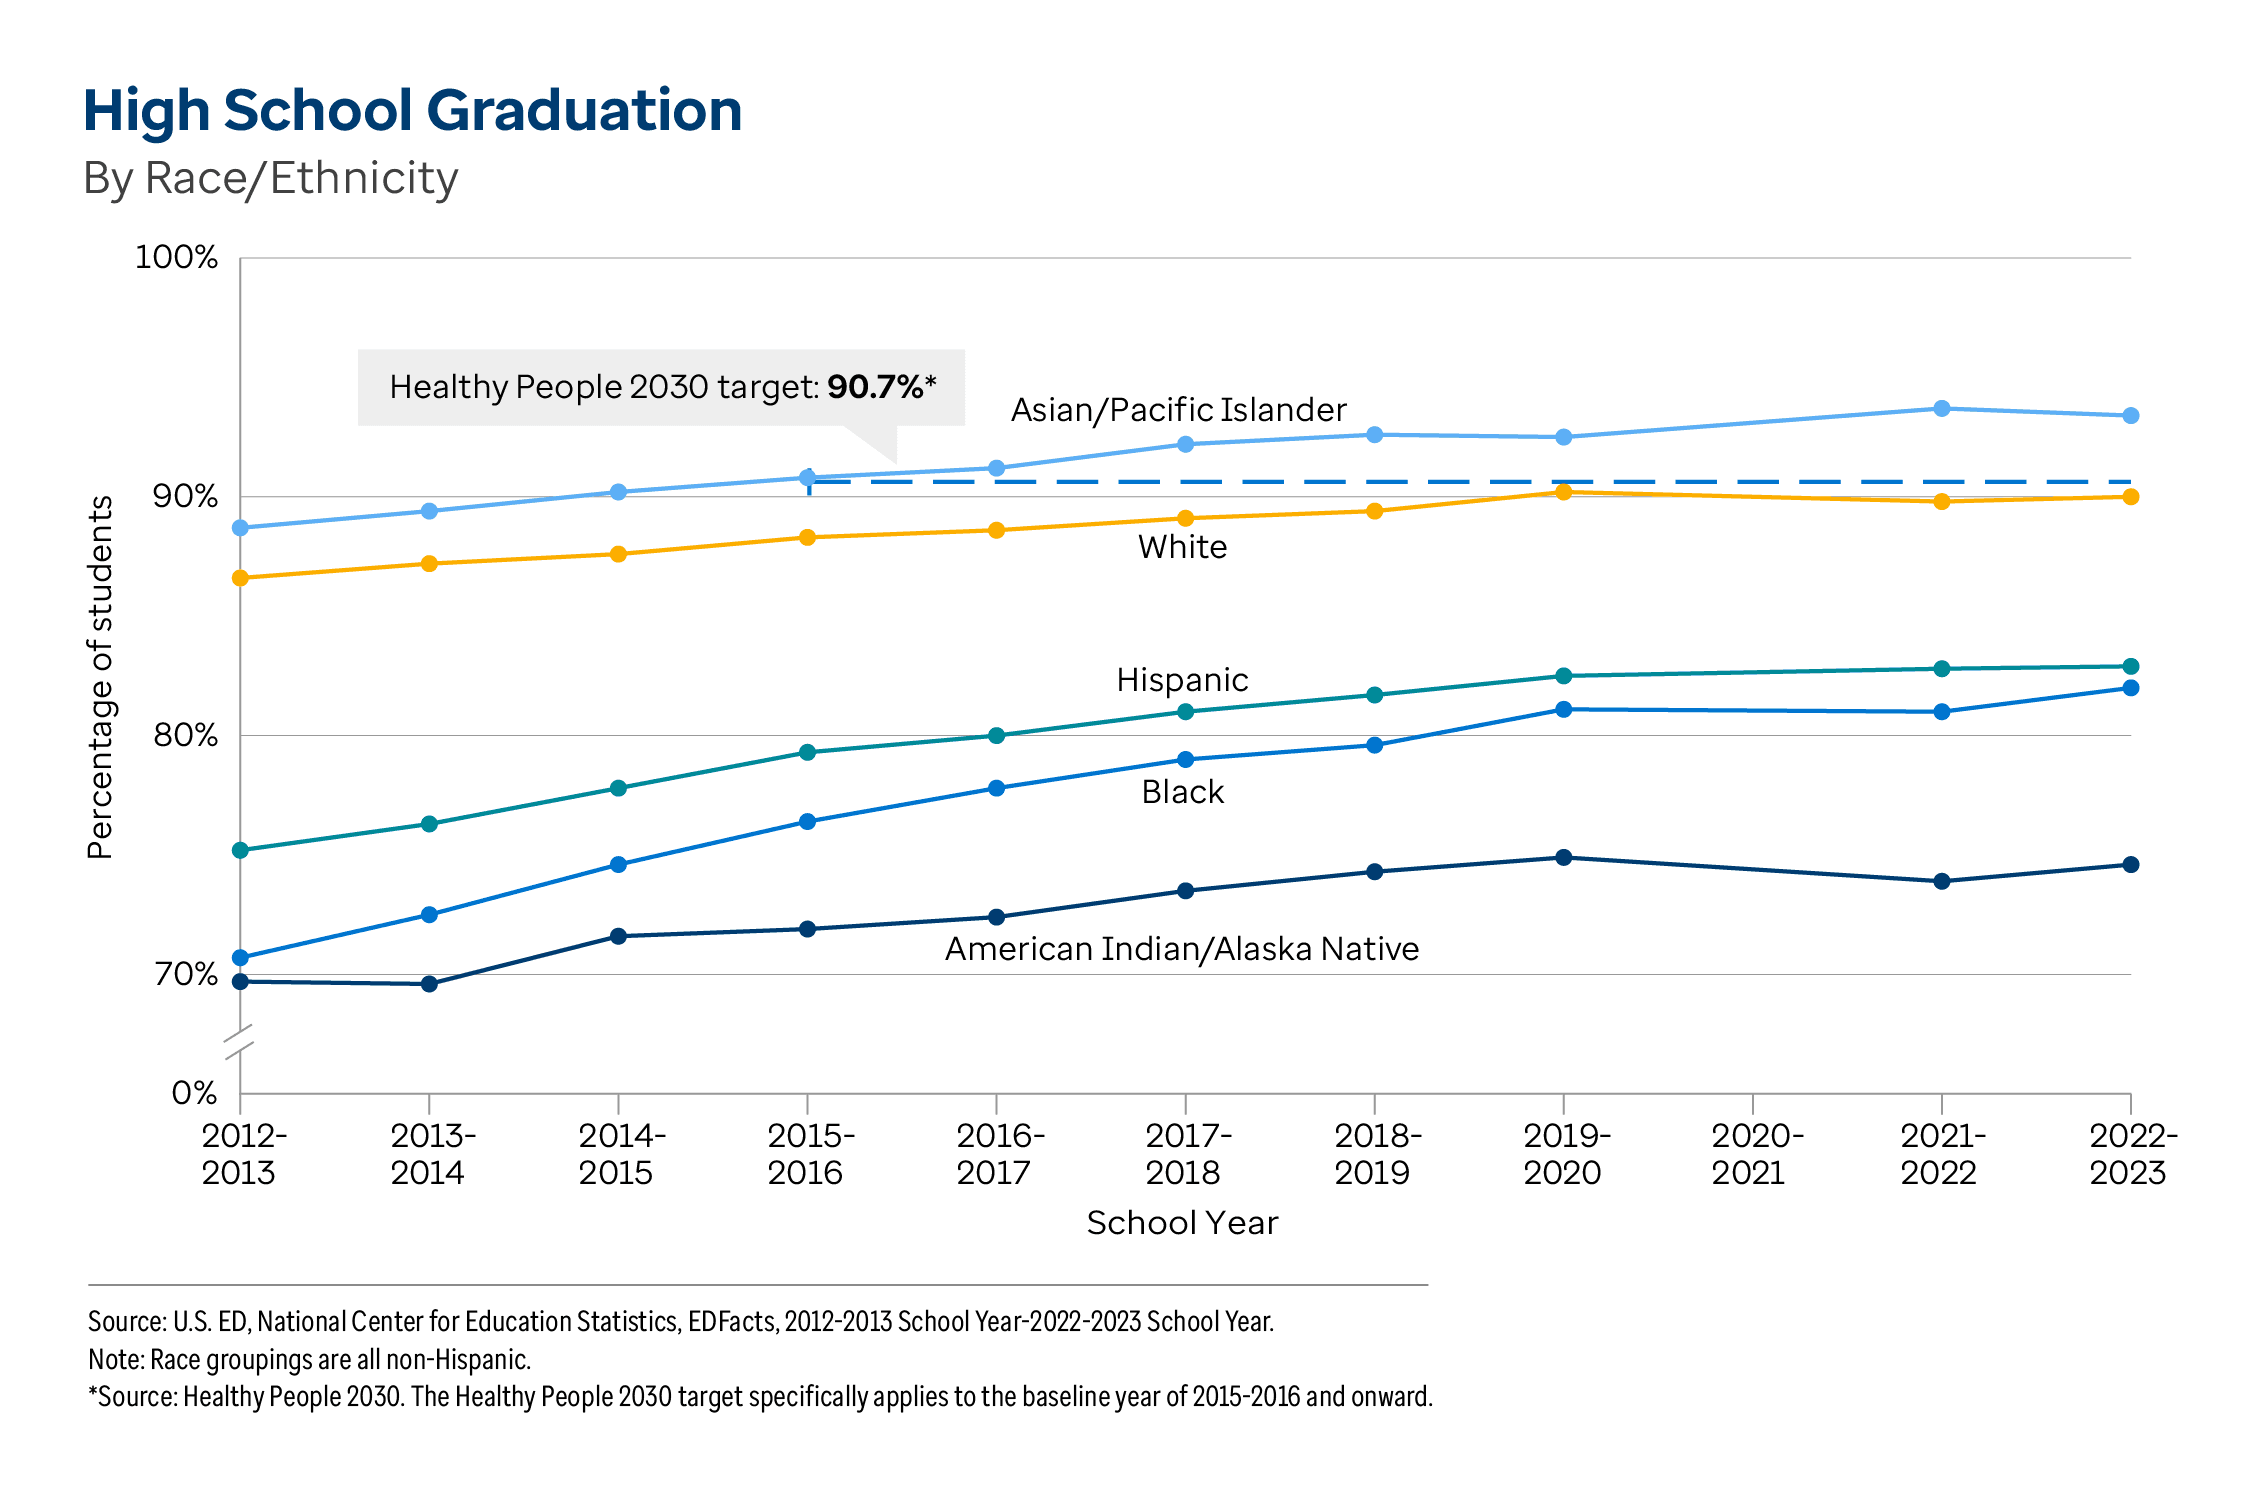
During the same time period, the rate of high school graduation increased 7% or more in 16 states and the District of Columbia. The largest increases were 23% in the
District of Columbia (62.3% to 76.5%) and 18% in
Oregon (68.7% to 81.3%),
Mississippi (75.5% to 89.4%) and
Georgia (71.7% to 84.4%).
Recent differences. The high school graduation rate varied by race/ethnicity and geography. In the 2022-2023 school year, the rate was:
- 1.3 times higher among Asian/Pacific Islander (93.4% of students) compared with American Indian/Alaska Native (74.6%) students.
- 1.2 times higher in West Virginia (92.6%) than in the District of Columbia (76.5%) and New Mexico (76.5%).

 US Summary
 Alabama
 Alaska
 Arizona
 Arkansas
 California
 Colorado
 Connecticut
 Delaware
 District of Columbia
 Florida
 Georgia
 Hawaii
 Idaho
Idaho Illinois
 Indiana
 Iowa
Iowa Kansas
 Kentucky
 Louisiana
 Maine
Maine Maryland
 Massachusetts
 Michigan
 Minnesota
 Mississippi
 Missouri
 Montana
 Nebraska
 Nevada
 New Hampshire
 New Jersey
 New Mexico
 New York
 North Carolina
 North Dakota
 Ohio
Ohio Oklahoma
 Oregon
 Pennsylvania
 Rhode Island
 South Carolina
 South Dakota
 Tennessee
 Texas
Texas Utah
Utah Vermont
 Virginia
 Washington
 West Virginia
 Wisconsin
 Wyoming