Health insurance is crucial for ensuring women receive the preventive and acute medical care they need to achieve and maintain good health.
50 Coverage also offers
financial protection against high medical expenses.
51 Changes over time. Nationally, the
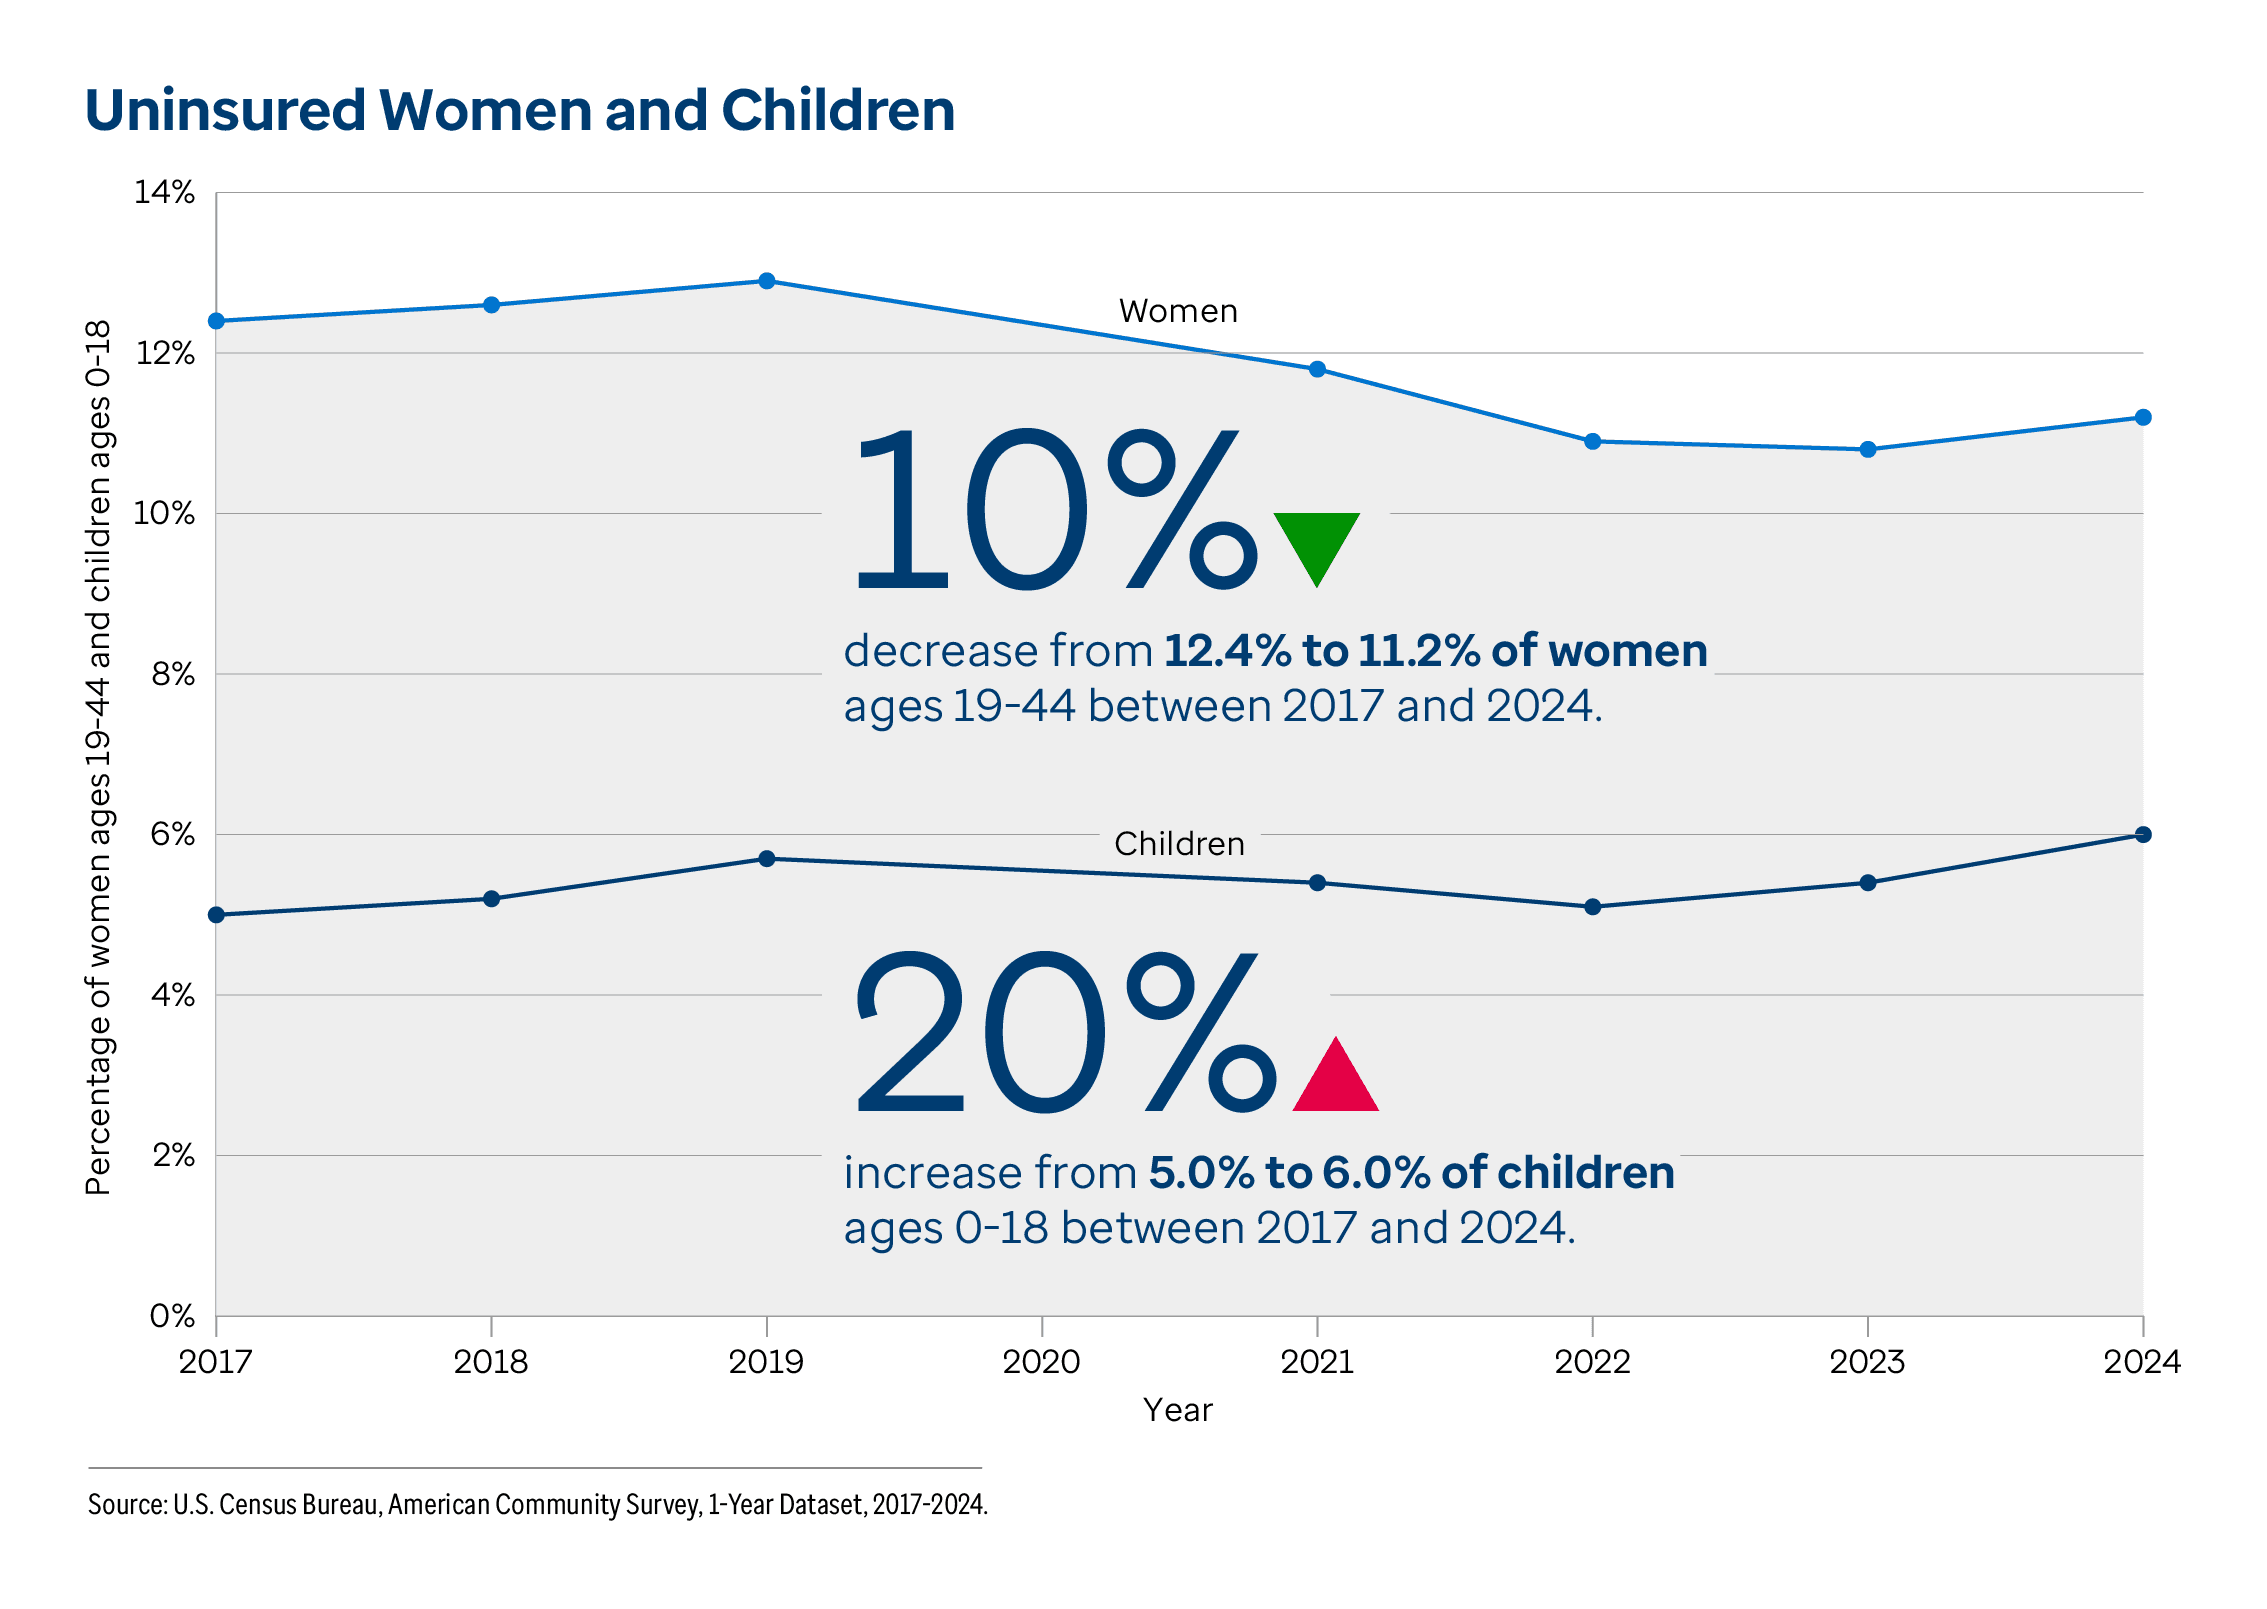
uninsured rate — the percentage of women ages 19-44 not covered by private or public health insurance — decreased 10% from 12.4% to 11.2% between 2017 and 2024. However, the rate of uninsured women increased 4% in 2024 (from 10.8% in 2023). In 2024, 6.5 million women were uninsured, a decrease of 300,000 women compared with 2017.
Between 2017 and 2024, the uninsured rate among women increased in five states and decreased in 17 states. The largest increases were 31% in
Minnesota (5.4% to 7.1%), 28% in
Connecticut (7.1% to 9.1%) and 22% in
Arkansas (11.6% to 14.2%). The largest decreases were 34% in
Maine (12.0% to 7.9%), 30% in
Idaho (16.8% to 11.8%) and 29% in
Oregon (9.4% to 6.7%).
Recent differences. In 2024, the rate among women ages 19-44 was 6.7 times higher in
Texas (22.7%) than in
Massachusetts (3.4%).
Related Measure: Avoided Care Due to Cost Among WomenNationally, the prevalence of
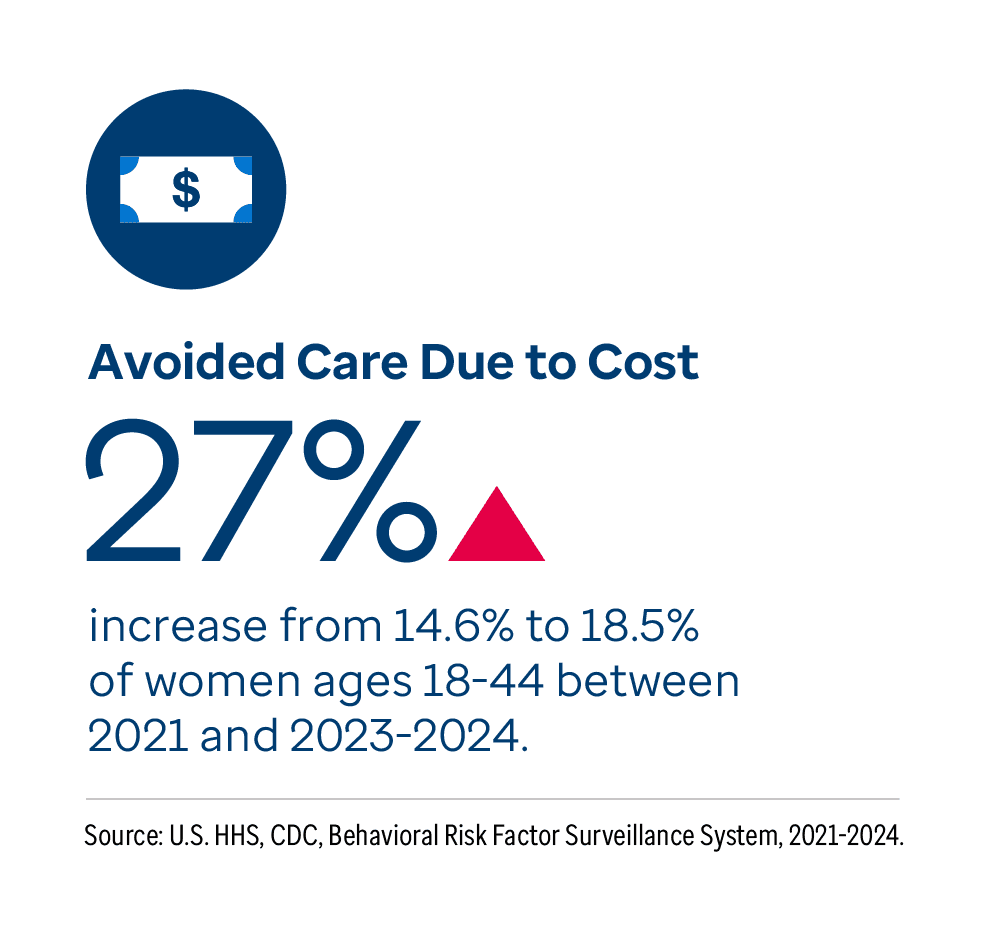
avoided care due to cost — the percentage of women ages 18-44 who reported a time in the past 12 months when they needed to see a doctor but could not because of cost — increased 27% from 14.6% to 18.5% between 2021 and 2023-2024. In 2023-2024, 10.7 million women ages 18-44 avoided medical care due to cost.
Between 2021 and 2023-2024, the prevalence of avoiding care due to cost among women ages 18-44 significantly increased in 12 states. The largest increases were 69% in
New Jersey (11.7% to 19.8%), 60% in
Montana (12.3% to 19.7%) and 57% in
Nevada (16.1% to 25.2%). In 2023-2024, the prevalence was 2.9 times higher in
Texas (26.7%) than in
Hawaii (9.2%). The prevalence of avoiding care due to cost also significantly varied by income, disability status, race/ethnicity, education, sexual orientation, veteran status and age. For more information, view
avoided care due to cost data for women.
Health insurance is critical for ensuring that children receive the medical care they need to achieve and
maintain good health.
52 Children with
health insurance coverage are more likely to have a usual source of care and less likely to delay or forgo necessary medical care because of cost.
53 Changes over time. Nationally, the
uninsured rate — the percentage of children younger than 19 years not covered by private or public health insurance — increased 20% from 5.0% to 6.0% between 2017 and 2024. Notably, 11% of this increase occurred during the most recent period, between 2023 (5.4%) and 2024. In 2024, 4.6 million children were uninsured, an increase of more than 700,000 children compared with 2017.
Between 2017 and 2024, the uninsured rate among children increased in 15 states. The largest increases were 76% in
Idaho (4.6% to 8.1%), 75% in
Arkansas (4.4% to 7.7%) and 50% in
Washington (2.6% to 3.9%).
Recent differences. In 2024, the uninsured rate among children was 6.5 times higher in
Texas (13.6%) than in
Massachusetts (2.1%).
Adequate Insurance Among Children
Nearly
one-third of children in the United States are underinsured — meaning their health insurance does not adequately cover a sufficient portion of their care or health expenses.
52 Compared with adequately insured children, those who are underinsured have more
health care disadvantages, including delayed or forgone care, lack of a personal doctor and difficulty obtaining needed specialist care.
52 Changes over time. Nationally, the prevalence of
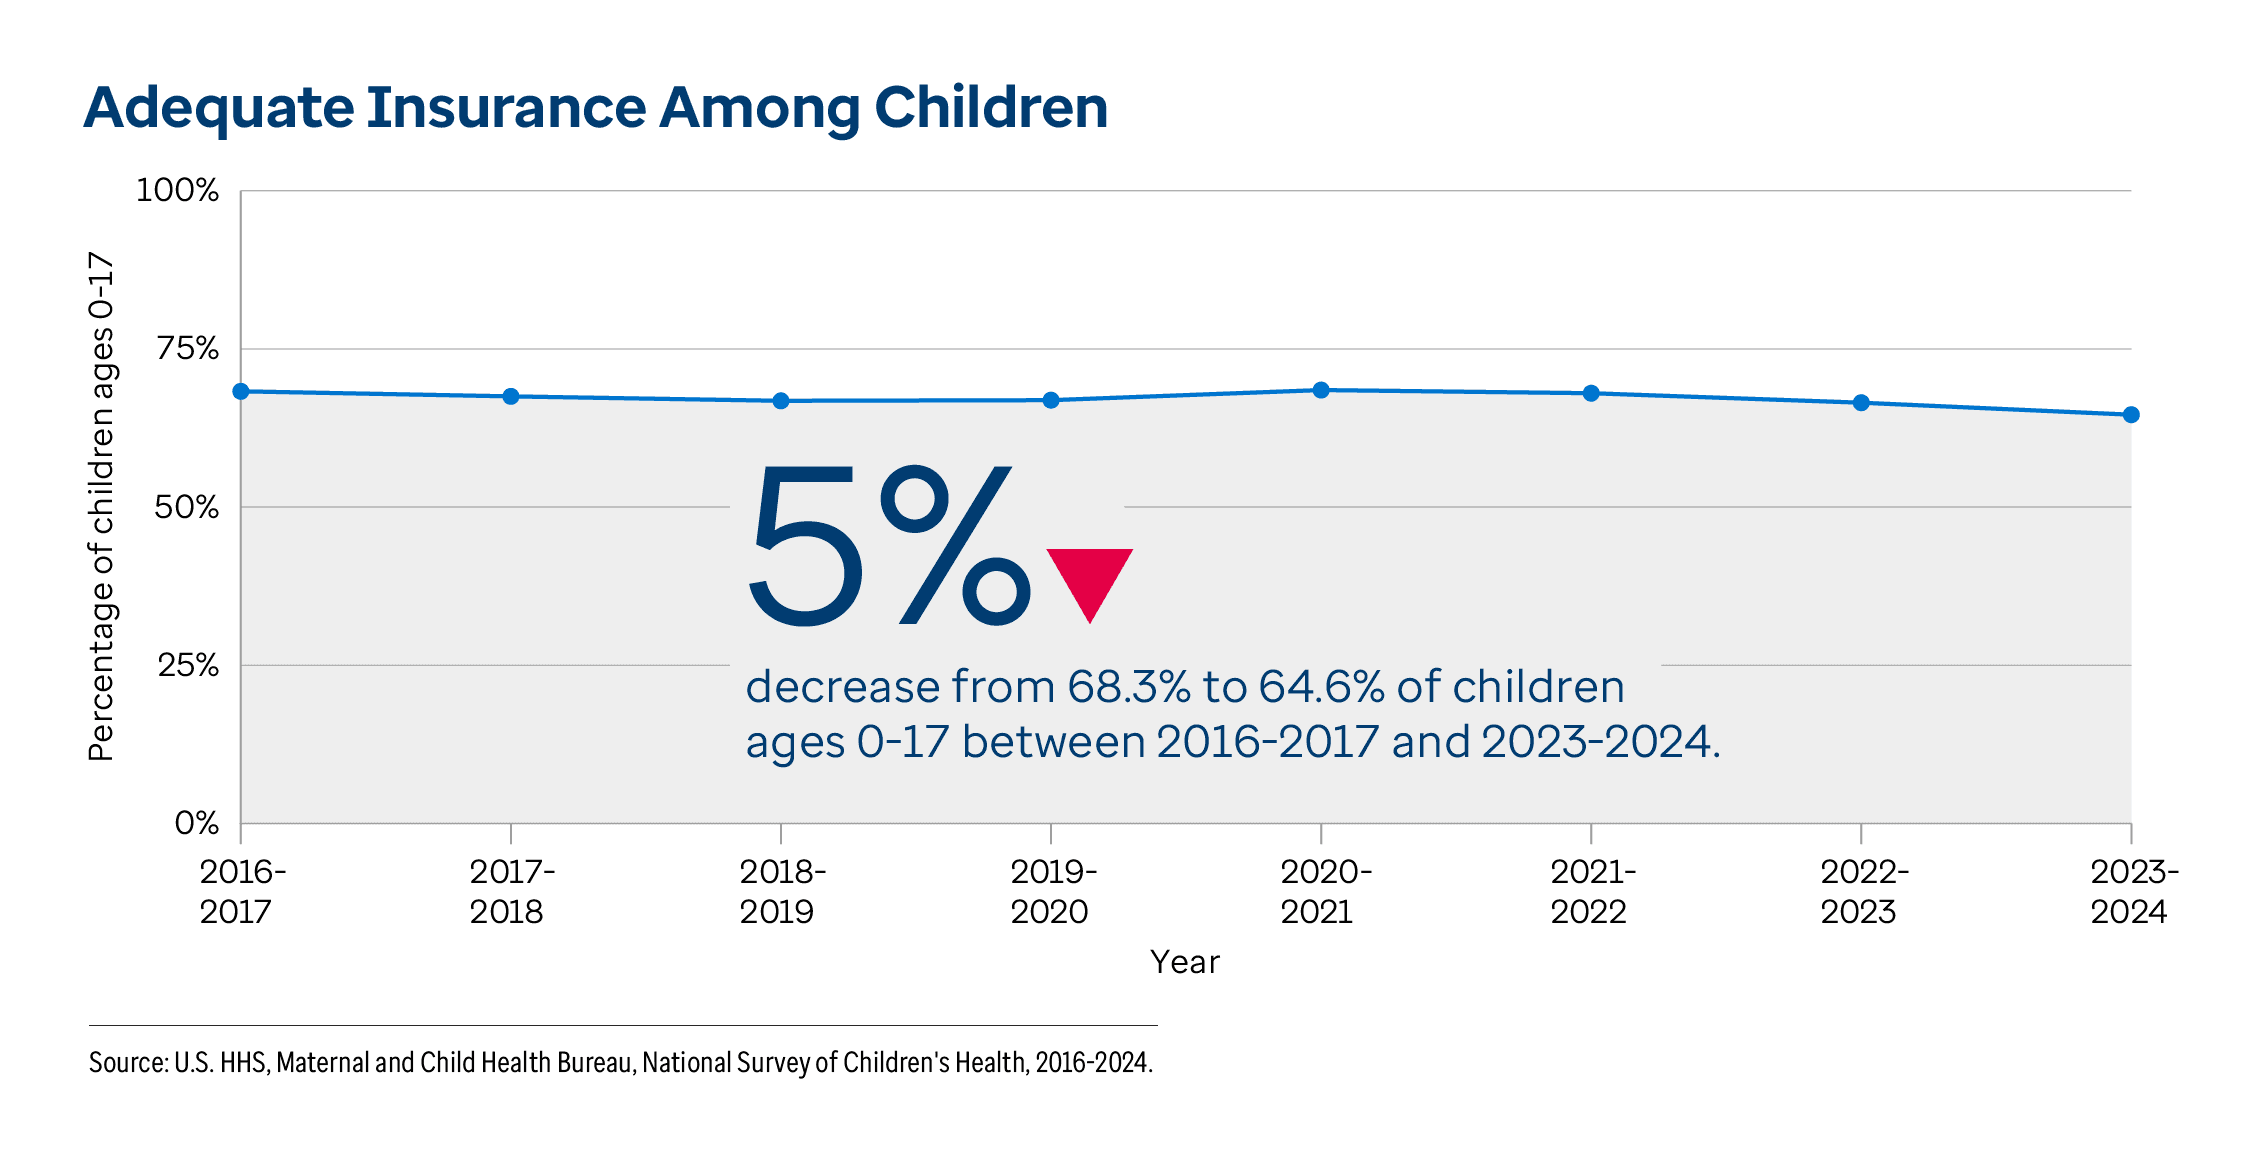
adequate insurance — the percentage of children ages 0-17 who were continuously insured in the past year with adequate coverage based on the following criteria: benefits meet the child’s needs; insurance allows the child to see needed providers; and insurance either has no or reasonable out-of-pocket expenses — decreased 5% from 68.3% to 64.6% between 2016-2017 and 2023-2024. In 2023-2024, 46.3 million children had adequate insurance, a decrease of 3.5 million children compared with 2016-2017.
Between 2016-2017 and 2023-2024, the prevalence of adequate insurance among children ages 0-17 significantly decreased:
During the same time period, the prevalence of adequate insurance significantly decreased in eight states and the District of Columbia. The largest decreases were 14% in the
District of Columbia (77.2% to 66.6%), 12% in both
Idaho (70.5% to 62.1%) and
Pennsylvania (72.2% to 63.7%), and 11% in both
Indiana (68.7% to 61.0%) and
Nebraska (65.1% to 58.2%).
Recent differences. The prevalence of adequate insurance significantly varied by geography, special health care needs status and caregiver educational attainment. In 2023-2024, the prevalence among children ages 0-17 was:
- 1.4 times higher in Hawaii (78.7%) than in Texas (56.7%).
- 1.1 times higher among children without special health care needs (66.4%) compared with children with special health care needs (59.8%).
- 1.1 times higher among children with a caregiver who graduated from high school (68.6%) compared with children whose caregivers have less than a high school education (61.2%).
Note: Differences highlight the groups with the highest and lowest values. However, the values for certain educational attainment groups may not differ significantly based on overlapping 95% confidence intervals. For more information, view
adequate insurance data for children.
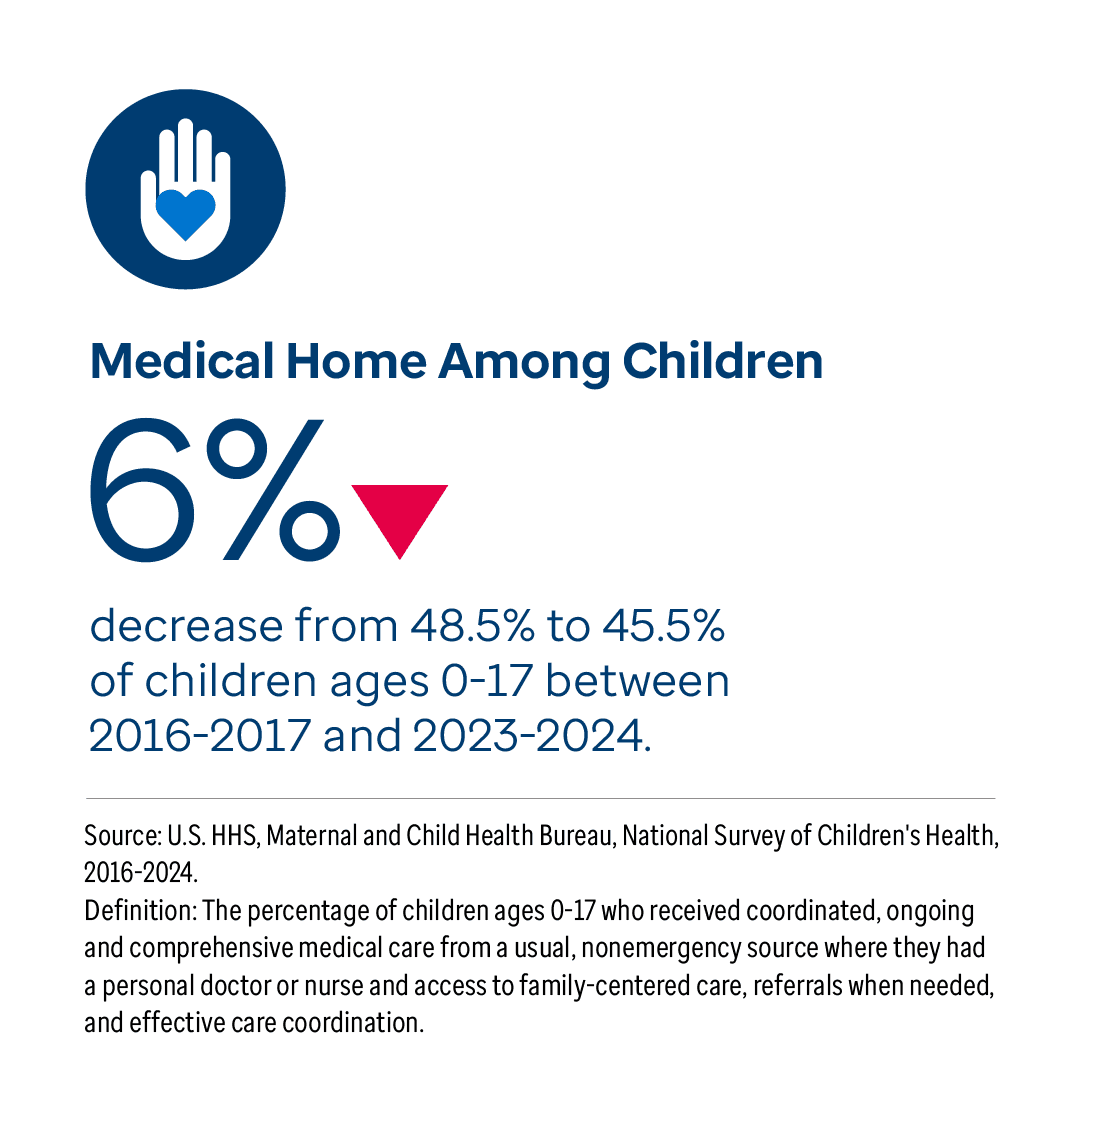
Between 2016-2017 and 2023-2024, the prevalence of medical home care among children ages 0-17 significantly decreased in four states: 19% in
Maryland (56.2% to 45.7%), 18% in
Connecticut (56.1% to 46.2%), 16% in
Massachusetts (58.7% to 49.2%) and 15% in
Washington (52.6% to 44.6%). In 2023-2024, the prevalence among children ages 0-17 was 1.6 times higher in
Vermont (57.8%) than in
Nevada (35.6%). The prevalence of medical home care also significantly varied across race/ethnicity, education and children with special health care needs. For more information, view
medical home data for children.
Preventive Clinical Services
Annual health exams provide an opportunity for women to access preventive services such as vaccines and
screening tests, which can help identify cancers and other conditions at an earlier stage when they are easier to treat.
55,56 Well-woman visits also provide an opportunity to
discuss strategies for minimizing health risks and achieving a healthy lifestyle.
57 Changes over the last decade. Nationally,
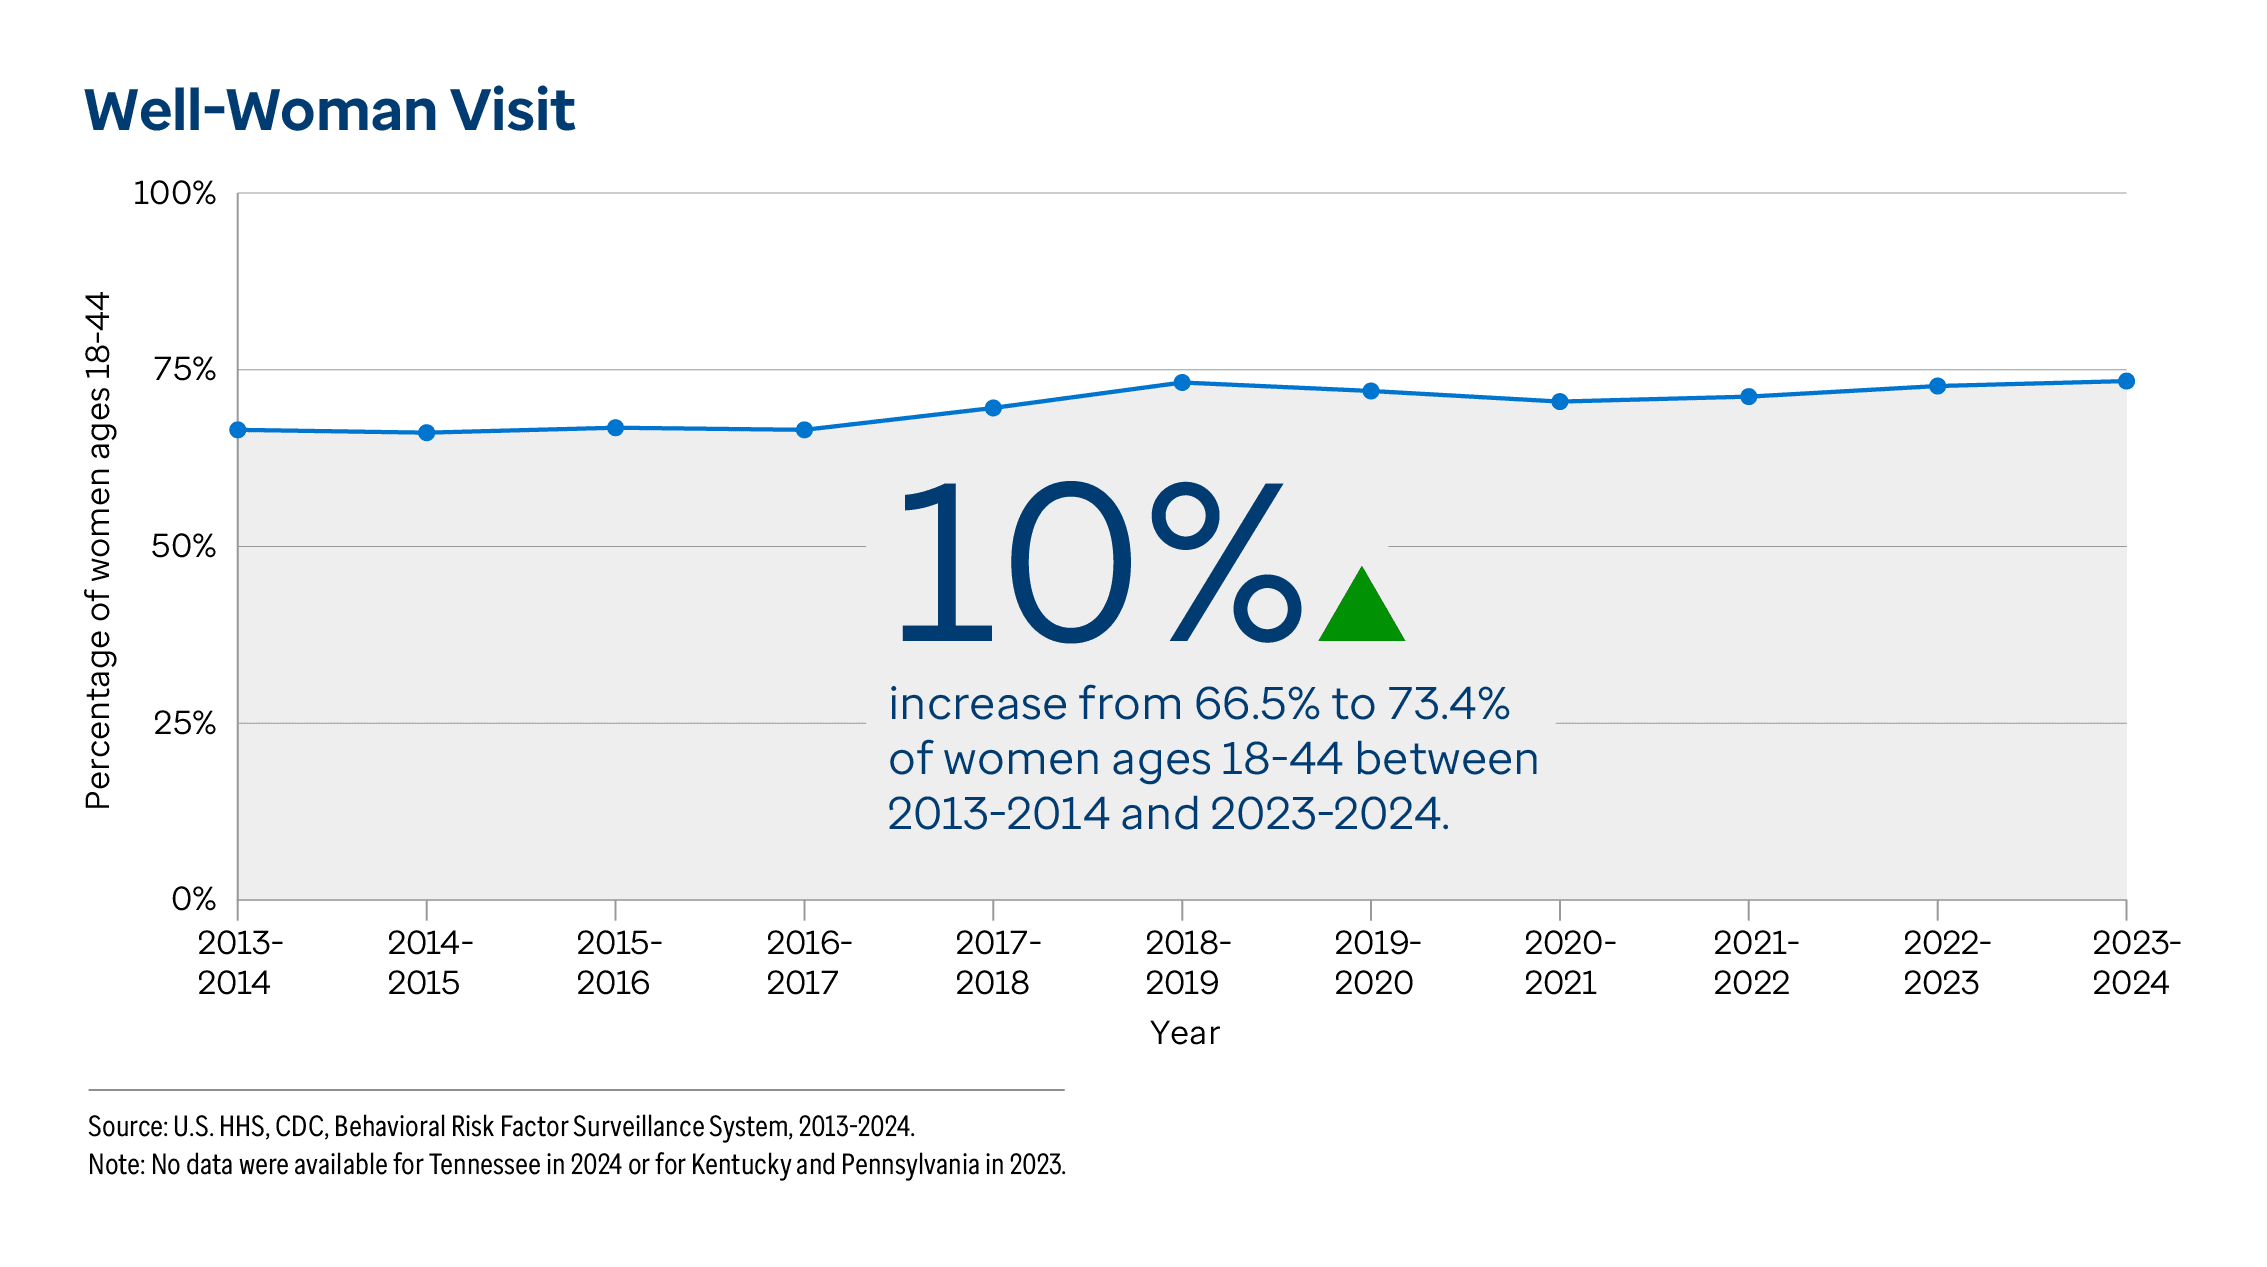
well-woman visits — the percentage of women ages 18-44 with a preventive medical visit in the past year — increased 10% from 66.5% to 73.4% between 2013-2014 and 2023-2024. In 2023-2024, 42.0 million women reported having a preventive medical visit in the past year, an increase of nearly 5.5 million women compared with 2013-2014.
In the decade between 2013-2014 and 2023-2024, well-woman visits significantly increased:
During the same time period, the prevalence significantly increased in 34 states. The largest increases were 36% in
Idaho (53.3% to 72.5%), 32% in
Indiana (58.9% to 77.7%) and 28% in
Alaska (55.0% to 70.4%).
Recent differences. The prevalence of well-woman visits significantly varied by educational attainment, race/ethnicity, age, disability status, income, sexual orientation and veteran status. In 2023-2024, the prevalence among women ages 18-44 was:
- 1.2 times higher among college graduates (78.2%) compared with women with less than a high school education (65.4%).
- 1.2 times higher among Black (81.5%) compared with Hawaiian/Pacific Islander (68.9%) women.
- 1.1 times higher among women ages 35-44 (75.9%) compared with women ages 18-24 (70.9%).
- 1.1 times higher among women with difficulty with mobility (76.6%) compared with women with independent living difficulty (67.1%).
- 1.1 times higher among women with an annual household income of $150,000 or more (80.0%) compared with women with an income of $25,000 to $49,999 (71.0%).
- 1.1 times higher among straight women (74.7%) compared with LGBQ+ women (70.4%).
- 1.1 times higher among women who have served in the U.S. armed forces (77.8%) compared with women who have not served (73.3%).
Note: No data were available for Tennessee in 2024 or for Kentucky and Pennsylvania in 2023. Differences highlight the groups with the highest and lowest values. However, the values for certain race/ethnicity, age, disability and income groups may not differ significantly based on overlapping 95% confidence intervals. For more information, view
well-woman visit data.
Related Measure: Flu Vaccination Among WomenNationally, the
flu vaccination rate — the percentage of women ages 18-44 who reported receiving a seasonal flu vaccine in the past 12 months — increased 3% from 32.8% to 33.9% in the 10 years between 2013-2014 and 2023-2024. However, flu vaccinations decreased 7% (from 36.4%) between 2021-2022 and 2023-2024. In 2023-2024, nearly 17.6 million women reported receiving the flu vaccine, an increase of 1.0 million women compared with 2013-2014.
In the decade between 2013-2014 and 2023-2024, the flu vaccination rate among women ages 18-44 significantly increased in seven states and the District of Columbia, while decreasing in eight states. The largest increases were 52% in the
District of Columbia (35.5% to 53.8% of women ages 18-44), 28% in
New Jersey (30.2% to 38.6%) and 26% in both
Vermont (38.5% to 48.5%) and
California (30.4% to 38.4%). The largest decreases were 25% in
Tennessee (35.1% to 26.5%), 22% in
Oklahoma (35.7% to 27.8%) and 21% in
Arkansas (36.2% to 28.7%). In 2023-2024, the rate among women ages 18-44 was 2.4 times higher in the District of Columbia (53.8%) and 2.3 times higher in
Massachusetts (51.0%) than in
Florida (22.1%). The flu vaccination rate also significantly varied by income, education, race/ethnicity, veteran status, disability status, metropolitan status, age and sexual orientation. For more information, view
flu vaccination data for women.
Note: No data were available for Tennessee in 2024 or for Kentucky and Pennsylvania in 2023.
The American Academy of Pediatrics
recommends that all infants, toddlers and children receive routine preventive visits, known as well-child visits.
58 Some of the
benefits of well-child visits include preventing illness through routine vaccinations, tracking growth and development and having opportunities to discuss parental concerns about child development, behavior, sleep and eating.
58 Changes over time. Nationally, the prevalence of
well-child visits — the percentage of children ages 0-17 who received one or more preventive medical visits in the past 12 months — decreased 3% from 82.1% to 79.6% between 2016-2017 and 2023-2024. In 2023-2024, 57.1 million children received a well-child visit, a decrease of 2.6 million children compared with 2016-2017.
Between 2016-2017 and 2023-2024, the prevalence of well-child visits significantly decreased:
During the same time period, the prevalence of well-child visits significantly decreased in three states: 9% in
Delaware (87.1% to 79.2%), 8% in
Rhode Island (88.9% to 82.2%) and 7% in
New Jersey (88.7% to 82.3%).
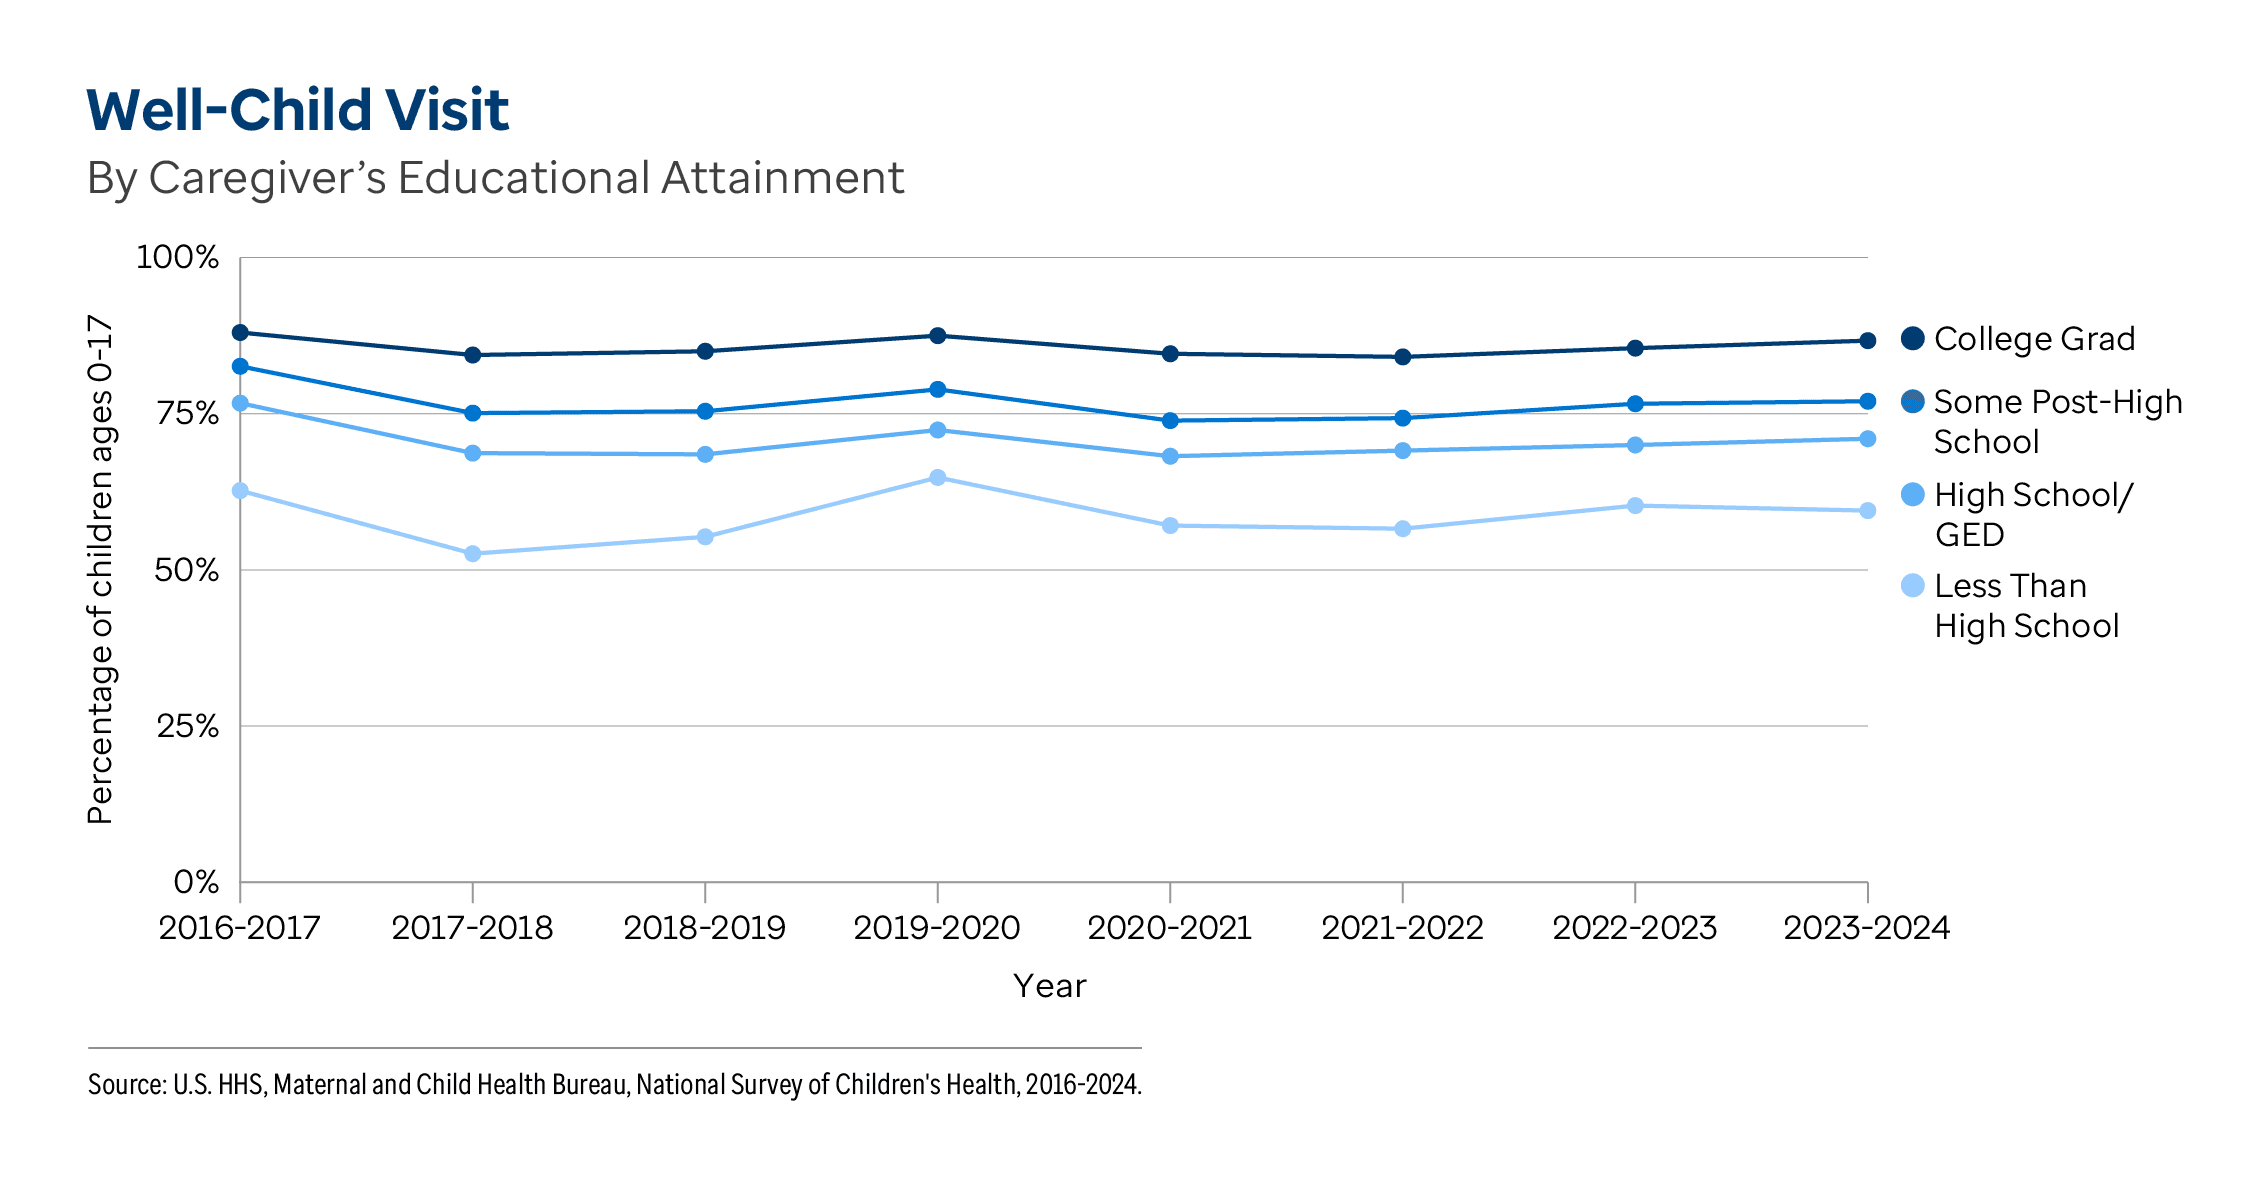
Recent differences. The prevalence of well-child visits significantly varied by caregiver educational attainment, geography, race/ethnicity, special health care needs status and age. In 2023-2024, the prevalence among children was:
Note: Differences highlight the groups with the highest and lowest values. However, the values for certain race/ethnicity groups may not differ significantly based on overlapping 95% confidence intervals. For more information, view
well-child visit data.
Related Measure: PediatriciansNationally, the number of
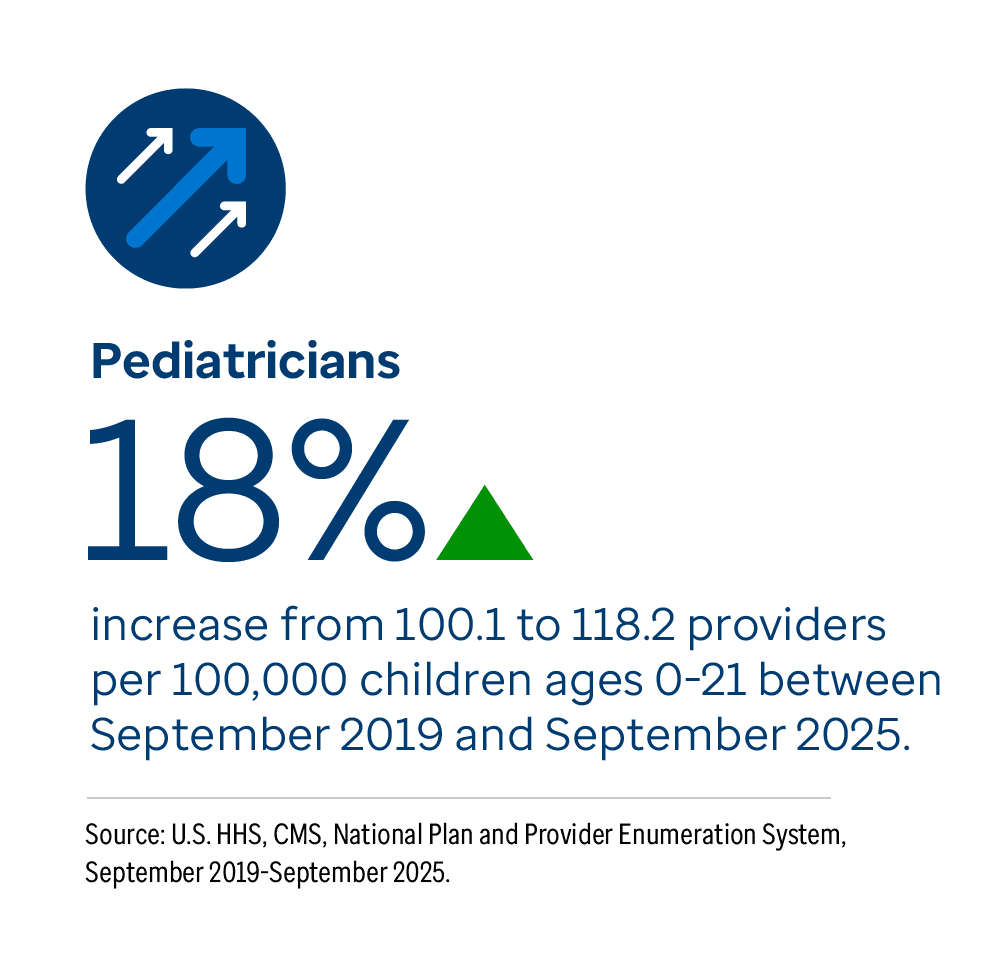
pediatricians increased 18% from 100.1 to 118.2 per 100,000 children ages 0-21 between September 2019 and September 2025. In September 2025, there were nearly 110,000 pediatricians in the U.S.
Between September 2019 and September 2025, the number of pediatricians increased 18% or more in 33 states and the District of Columbia. The largest increases were 31% in
Oklahoma (61.8 to 81.2 per 100,000 children ages 0-21), 29% in both
Hawaii (113.2 to 146.3) and
Arkansas (68.4 to 88.3), and 26% in
Utah (69.2 to 87.3). In September 2025, the number of pediatricians was 4.4 times higher in
Massachusetts (224.2) than in
Idaho (51.3).

 US Summary
 Alabama
 Alaska
 Arizona
 Arkansas
 California
 Colorado
 Connecticut
 Delaware
 District of Columbia
 Florida
 Georgia
 Hawaii
 Idaho
Idaho Illinois
 Indiana
 Iowa
Iowa Kansas
 Kentucky
 Louisiana
 Maine
Maine Maryland
 Massachusetts
 Michigan
 Minnesota
 Mississippi
 Missouri
 Montana
 Nebraska
 Nevada
 New Hampshire
 New Jersey
 New Mexico
 New York
 North Carolina
 North Dakota
 Ohio
Ohio Oklahoma
 Oregon
 Pennsylvania
 Rhode Island
 South Carolina
 South Dakota
 Tennessee
 Texas
Texas Utah
Utah Vermont
 Virginia
 Washington
 West Virginia
 Wisconsin
 Wyoming